Want to see RevSure in action
Schedule a 30-minute demo
Book a Demo
Back to Templates


A full-funnel, cross-channel view of how marketing drives revenue
Marketing teams are under more pressure than ever to prove revenue impact. But most dashboards still stop at leads, clicks, and channel activity, leaving pipeline contribution, conversion efficiency, and ROI unclear. When performance data is fragmented across tools, teams struggle to understand what’s truly driving bookings, where the funnel is leaking, and which investments deserve more budget.
RevSure’s Revenue Marketing Dashboard Template solves this by delivering a unified view of how campaigns, channels, and content drive pipeline, bookings, and revenue outcomes. It connects spend, funnel progression, attribution, and content influence so marketing leaders can optimize with confidence and report results in revenue terms, not just lead volume.
This template is designed for B2B organizations running multi-channel demand generation across paid, organic, events, web, and outbound motions. Demand Gen teams, Marketing Ops, RevOps, and executive leaders use it to align marketing execution with pipeline creation and revenue performance.
By bringing attribution, funnel movement, ROI, and content impact into one shared view, the Revenue Marketing Dashboard Template helps teams move beyond siloed reporting and focus on what actually drives growth.
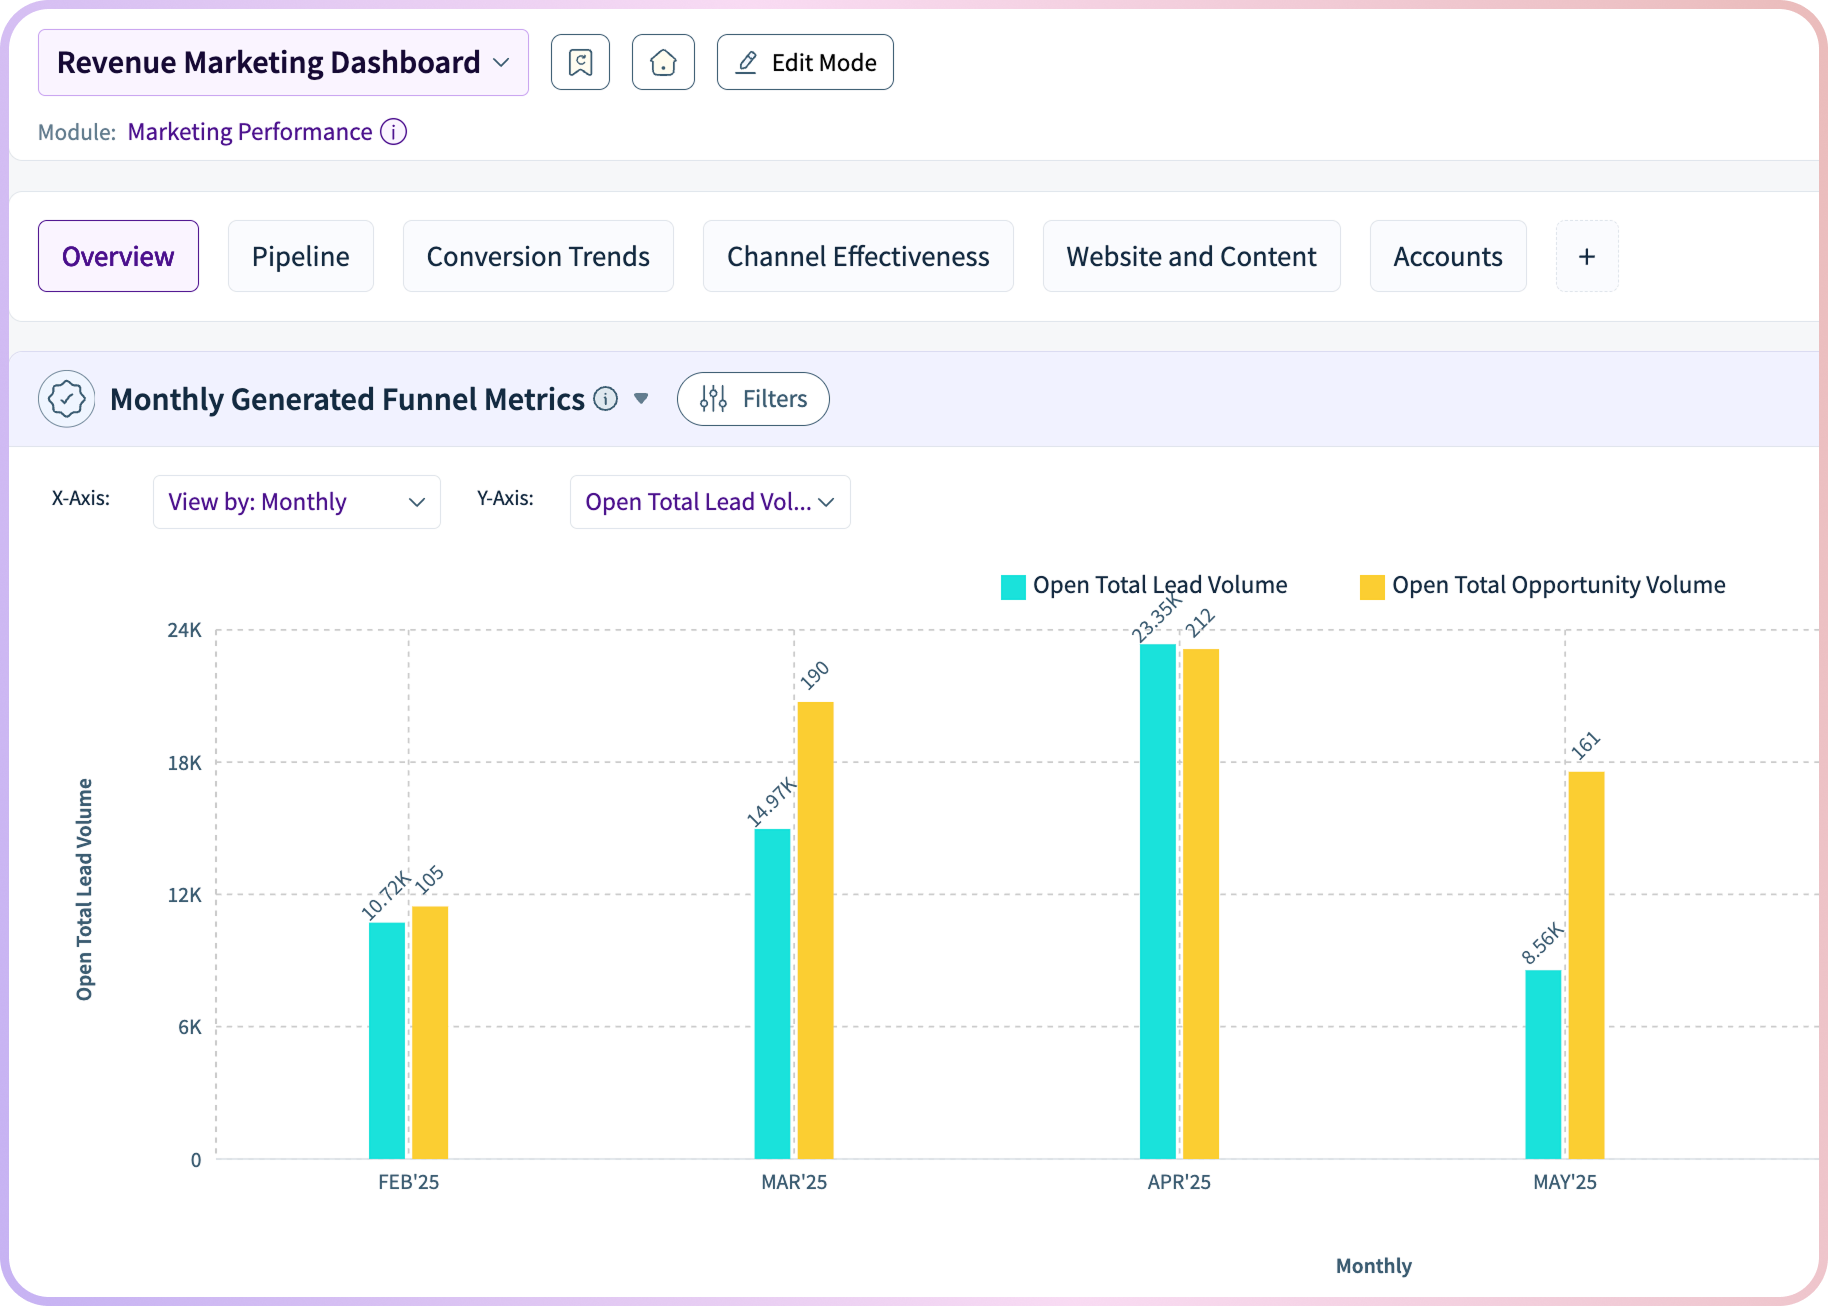
At the core of the dashboard is an executive-level overview of marketing health across spend, funnel activity, and ROI. Performance scorecards surface key KPIs, including total spend, lead volume, MQLs, pipeline value, bookings, and return on investment.
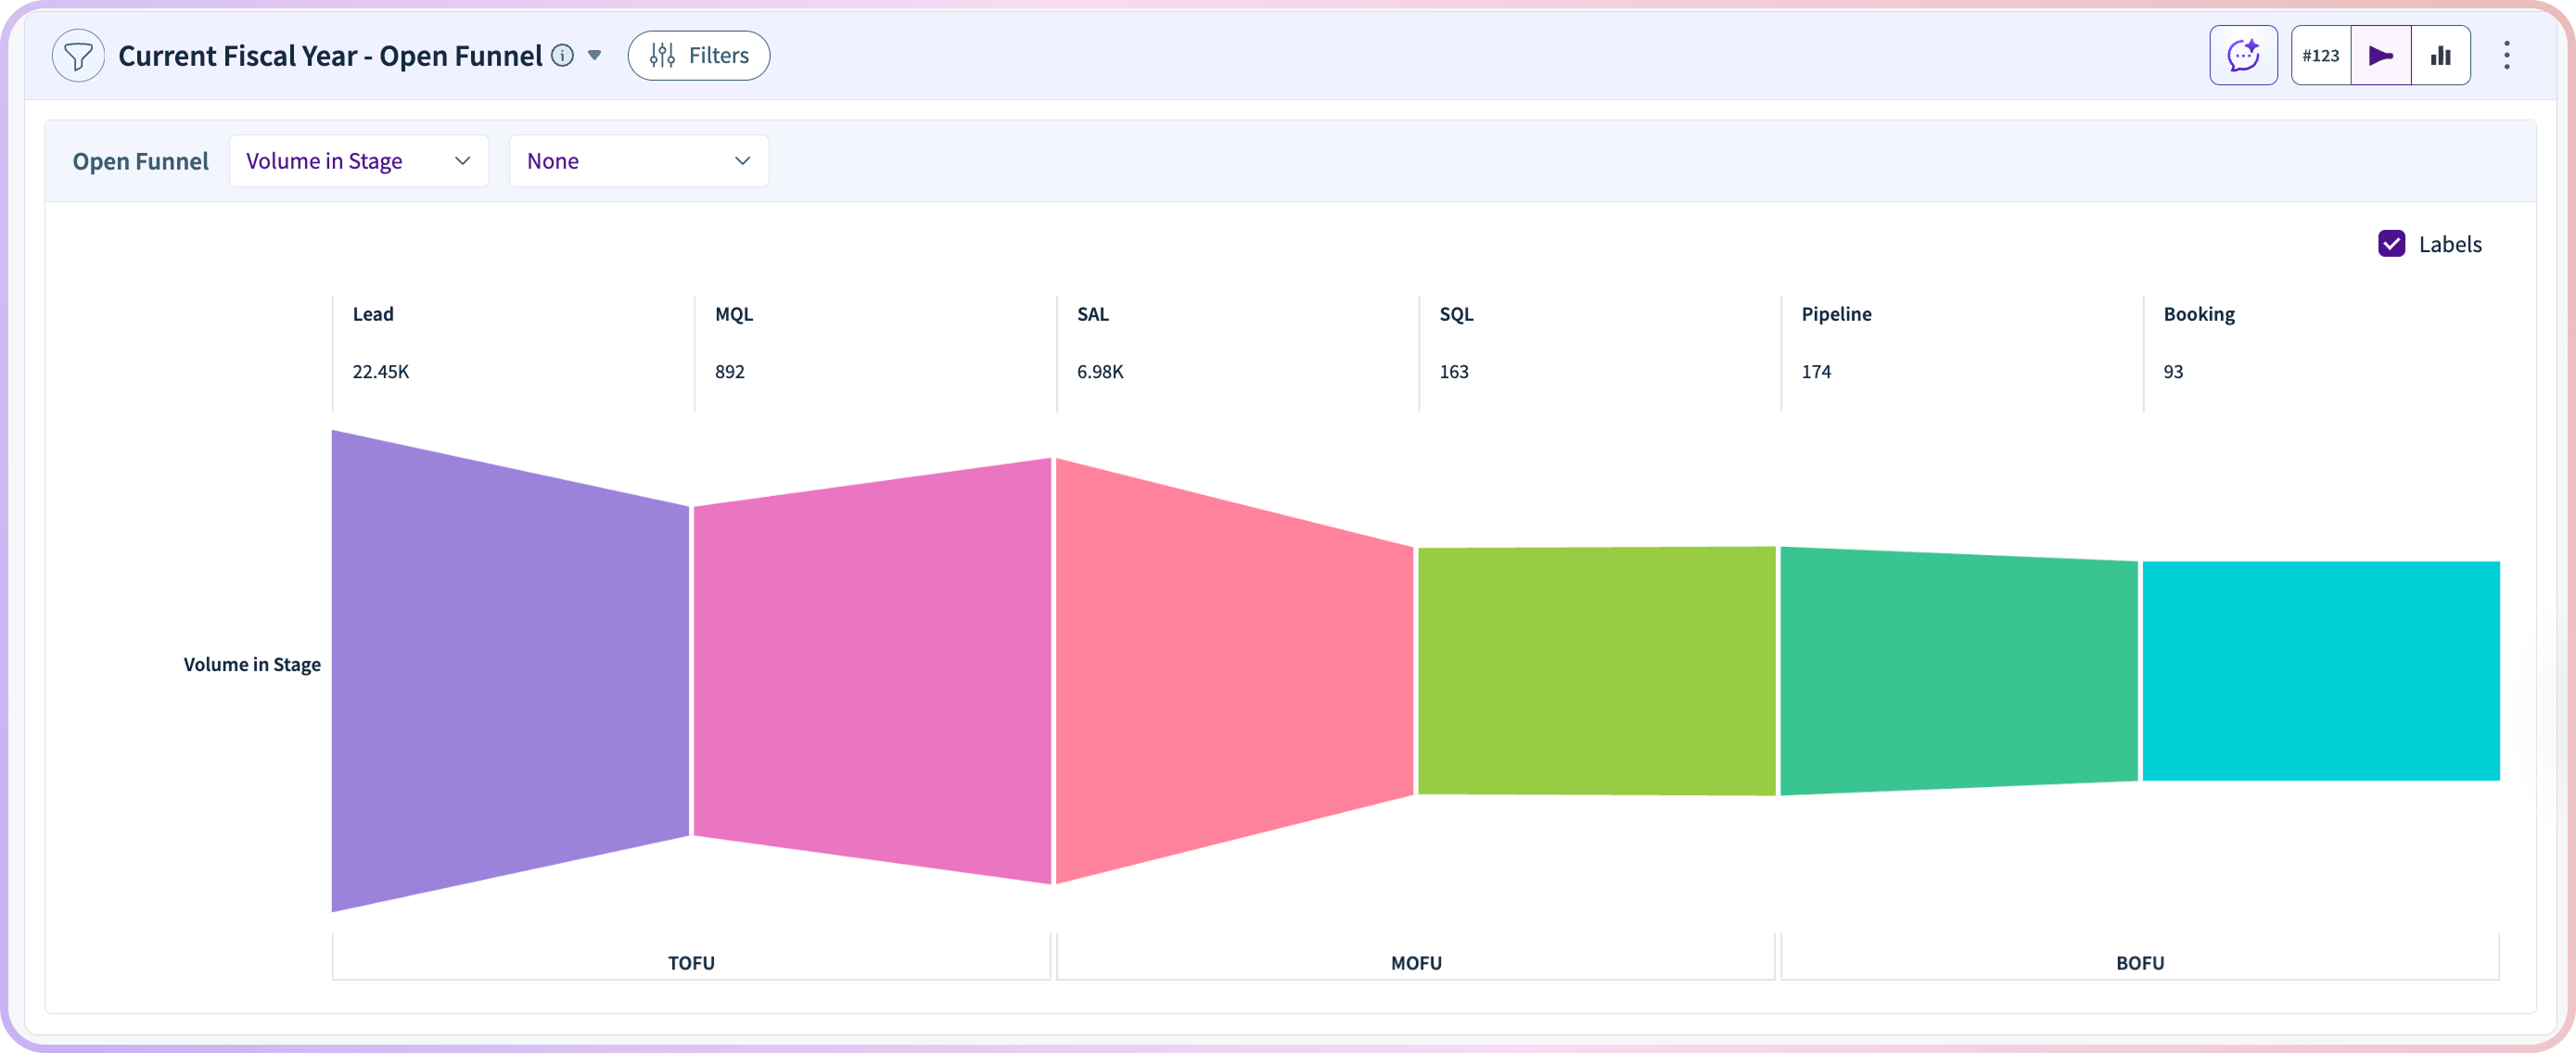
The dashboard also provides funnel snapshots that show progression from Lead → MQL → Opportunity → Booking, making it easy to identify where volume is strong, where conversion slows, and where funnel optimization is needed.
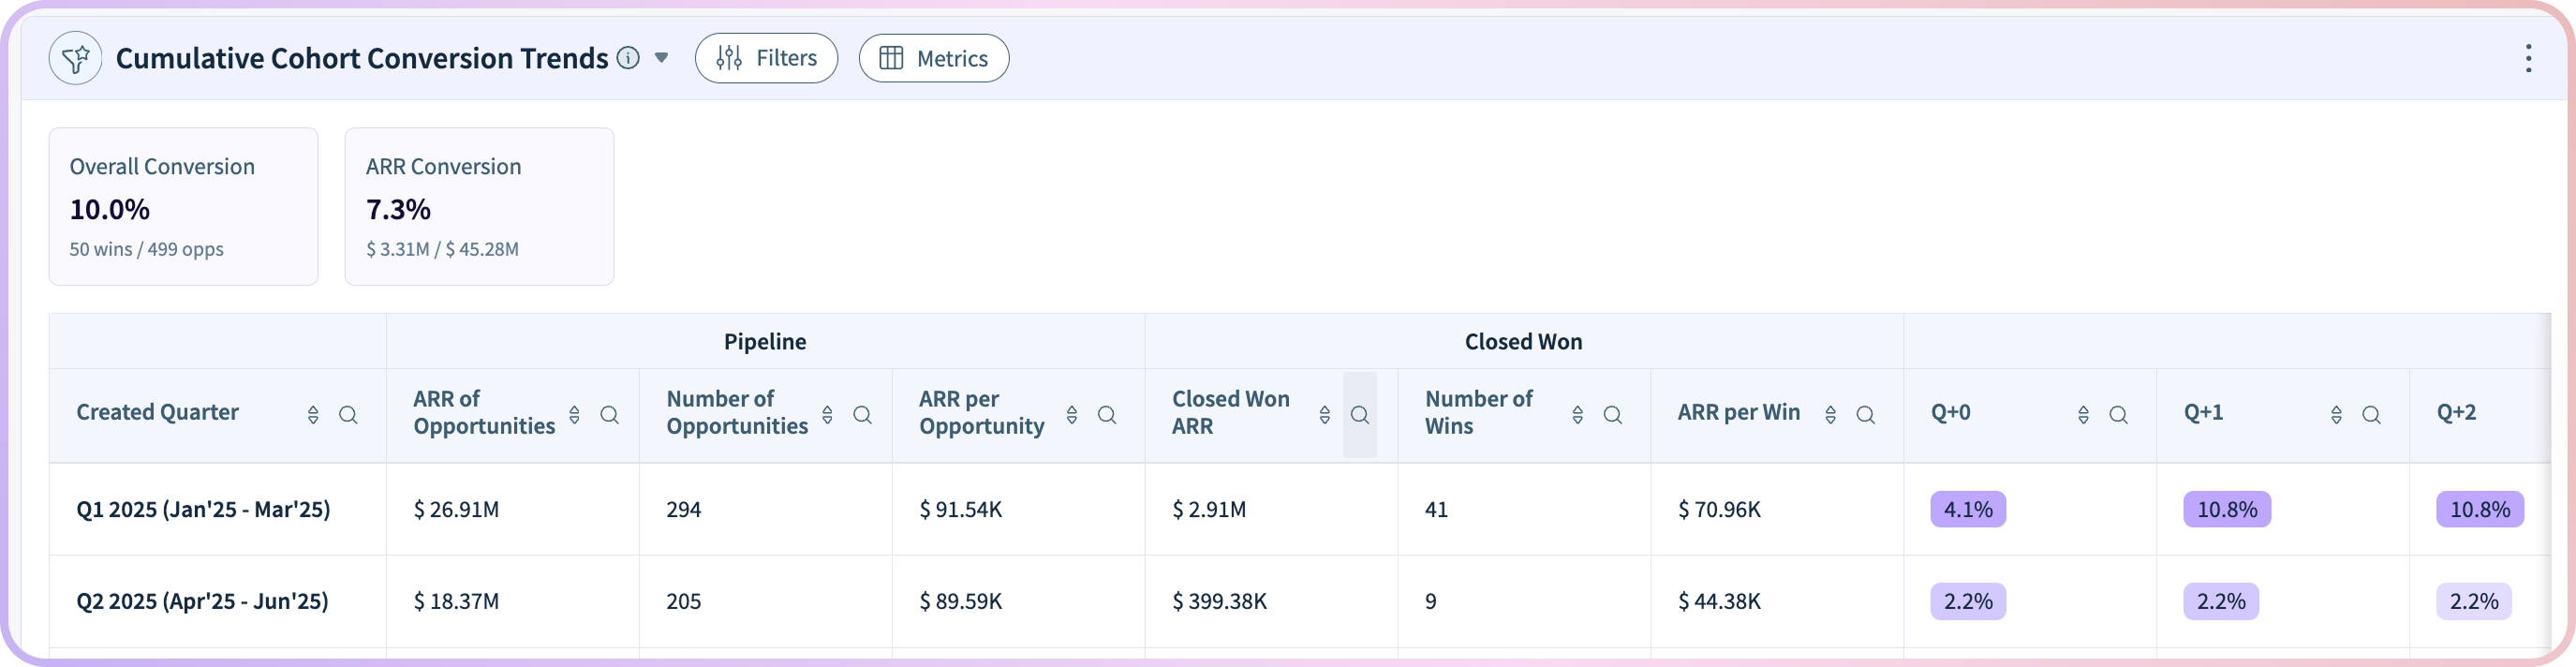
Cohort-based analysis adds another layer of clarity by tracking how defined groups move through the funnel over time, helping teams evaluate conversion strength, pipeline momentum, and account-level progression.
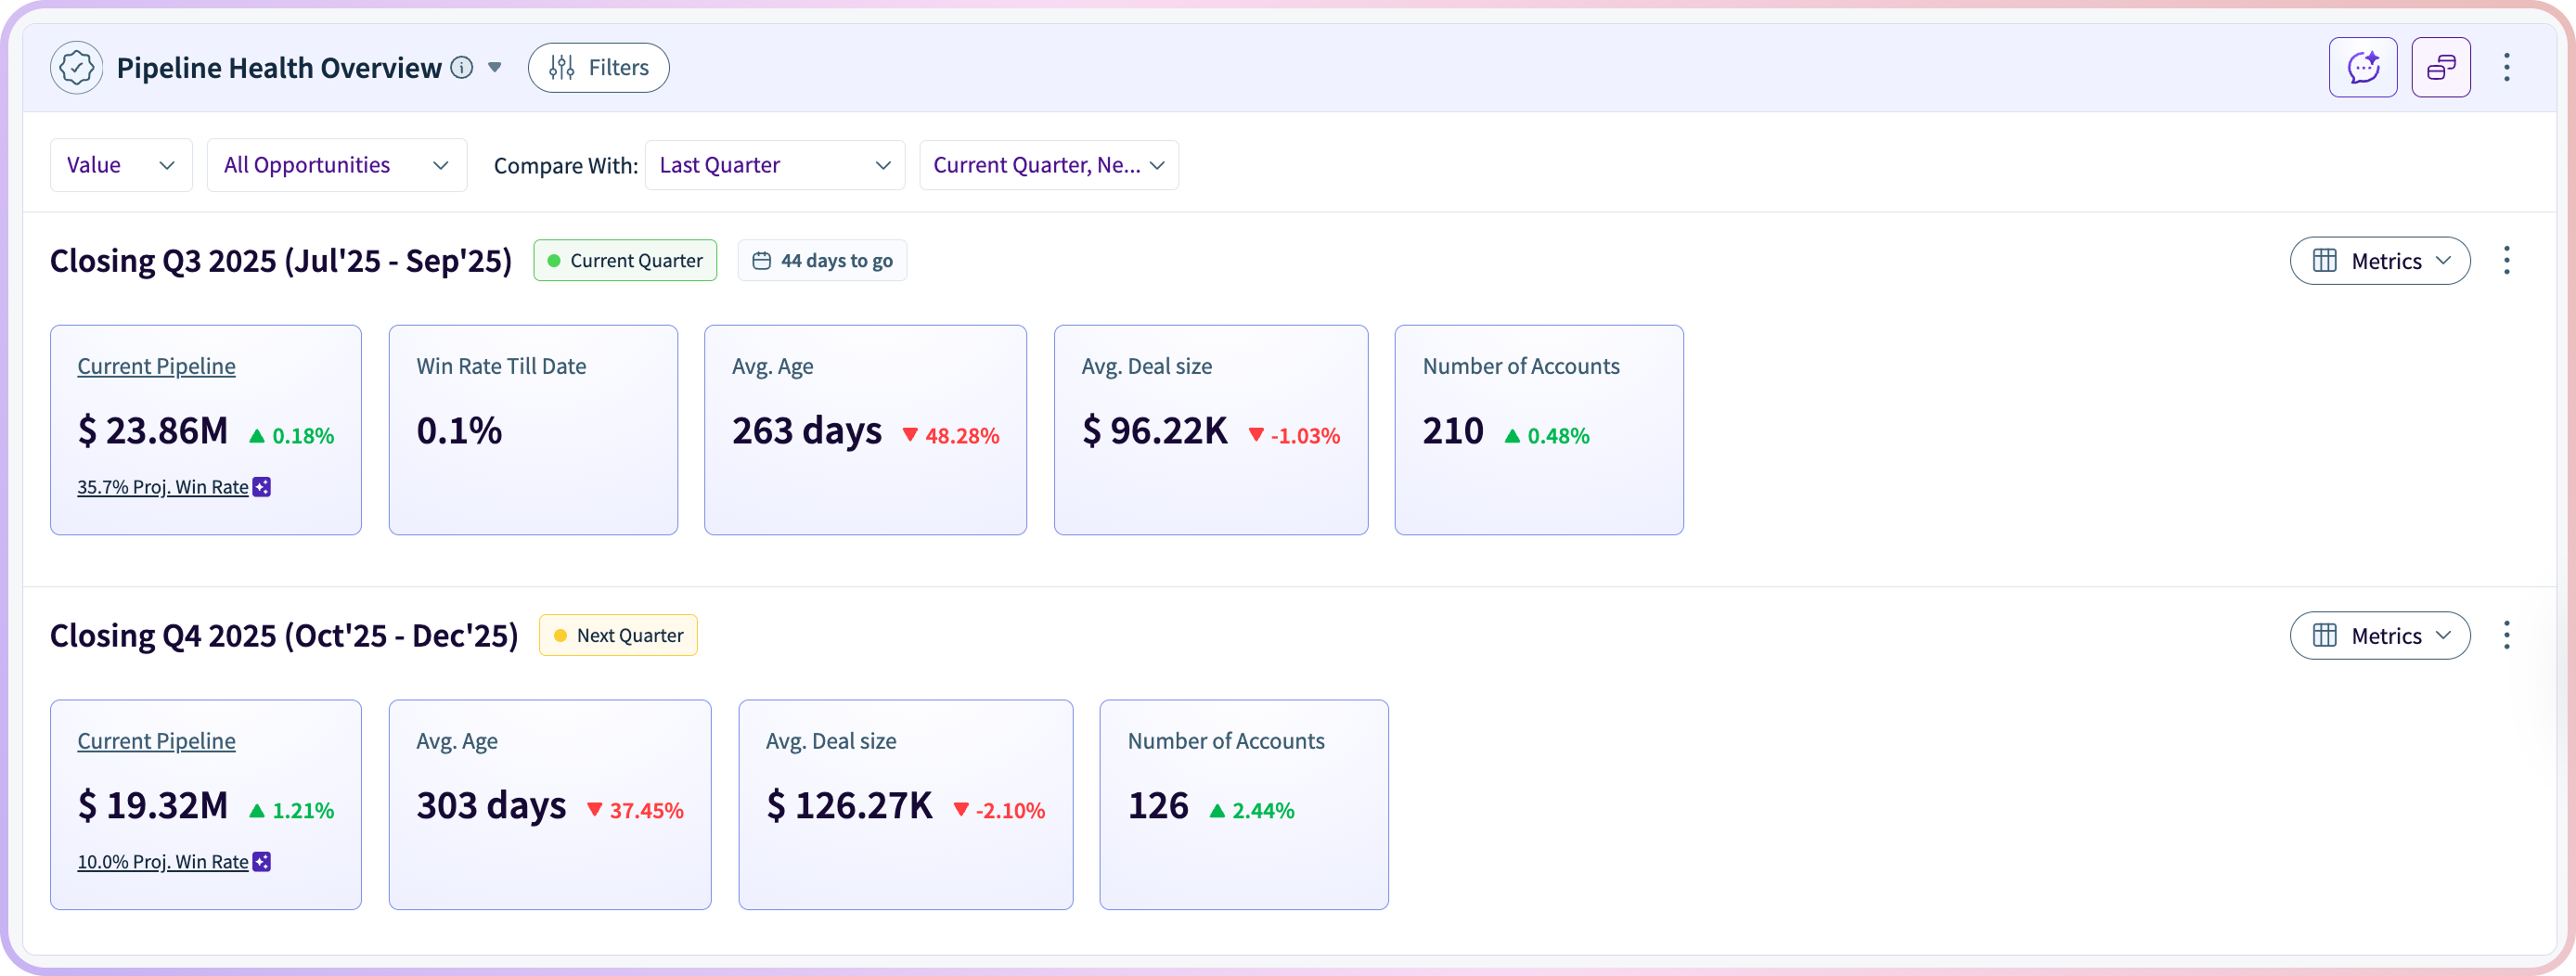
Beyond topline reporting, the template clarifies how marketing efforts translate into real opportunity creation and pipeline health. Pipeline views highlight current pipeline value, win rate, deal age, and stage distribution, exposing where deals are aging or overly concentrated.
Conversion trend views, then diagnose where leads most commonly drop off, tracking progression across key stages such as:
These insights help teams identify leakage points early, improve qualification efficiency, and strengthen handoffs between marketing and sales.
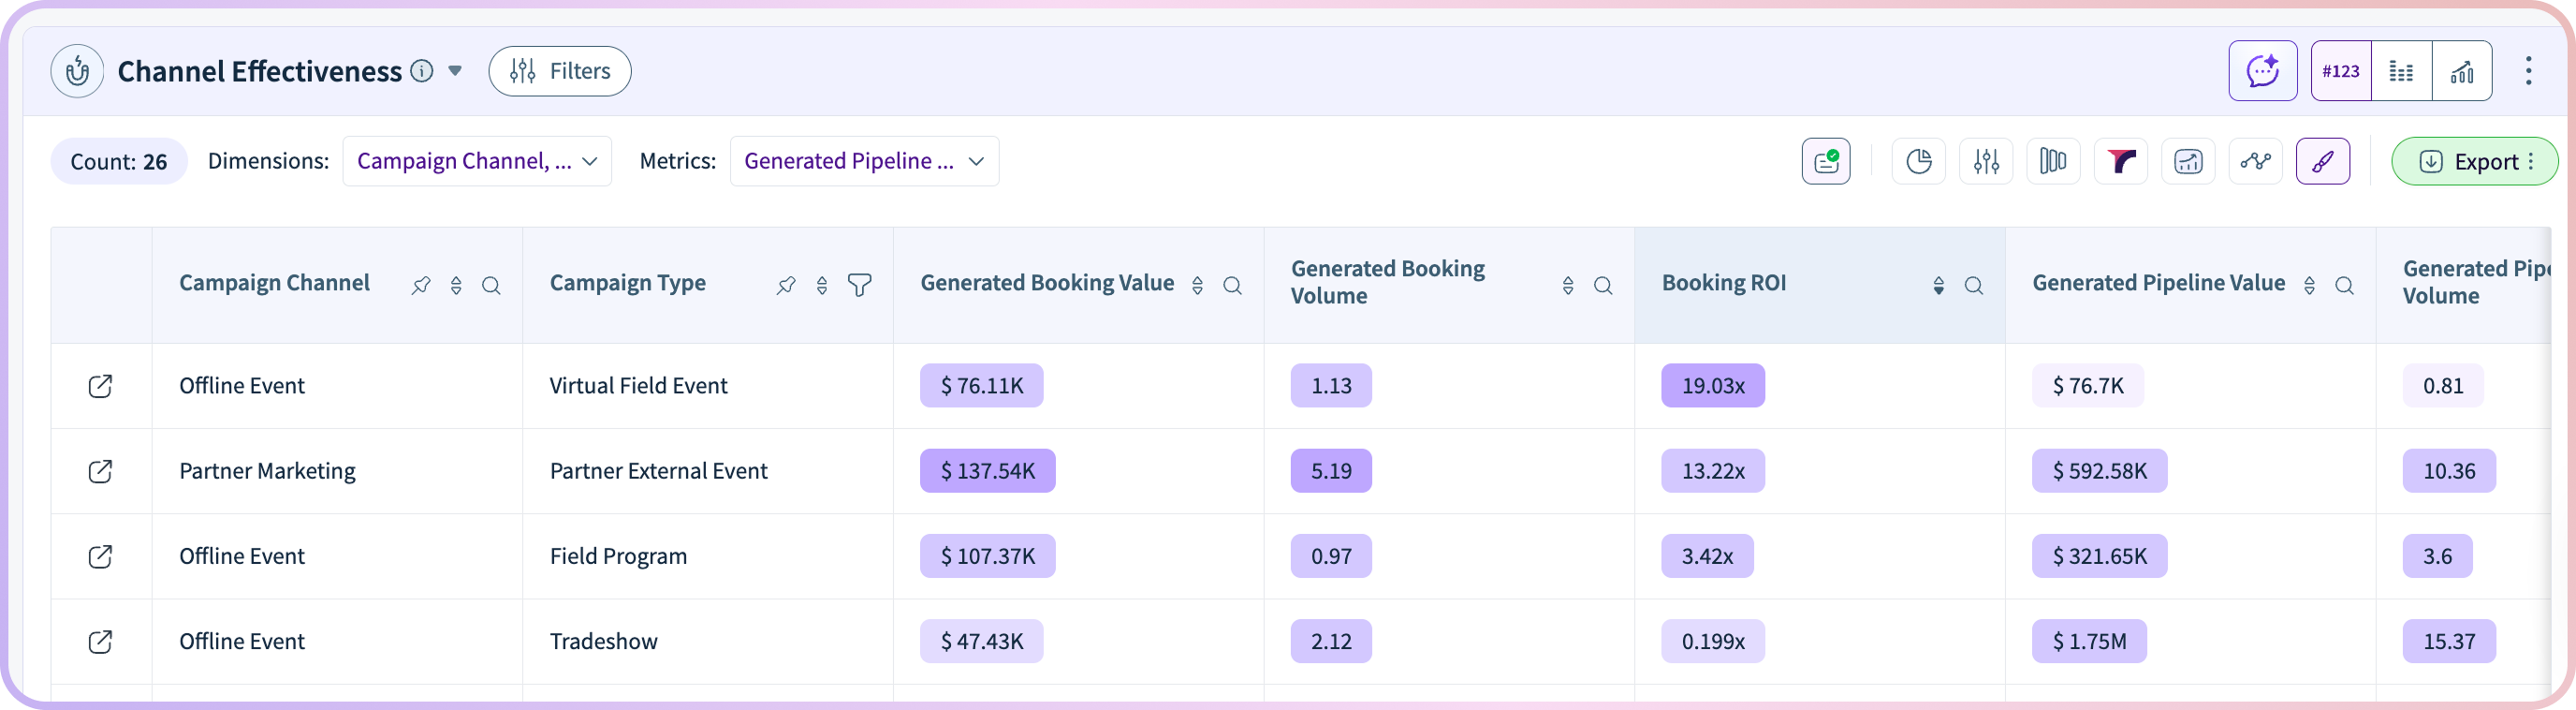
To support smarter investment decisions, the dashboard evaluates channel and campaign ROI across the funnel. Channel effectiveness tables compare spend, pipeline generated, bookings, and ROI across major demand channels, surfacing what delivers the highest revenue impact per dollar.
Top-performing paid and website campaigns are ranked by pipeline contribution and booking efficiency, helping teams scale what works and refine underperforming efforts.
The template also provides deep visibility into the website and content influence. Journey and touchpoint views reveal which pages consistently appear before MQL conversion, highlighting high-impact content paths and digital assets that drive quality pipeline.
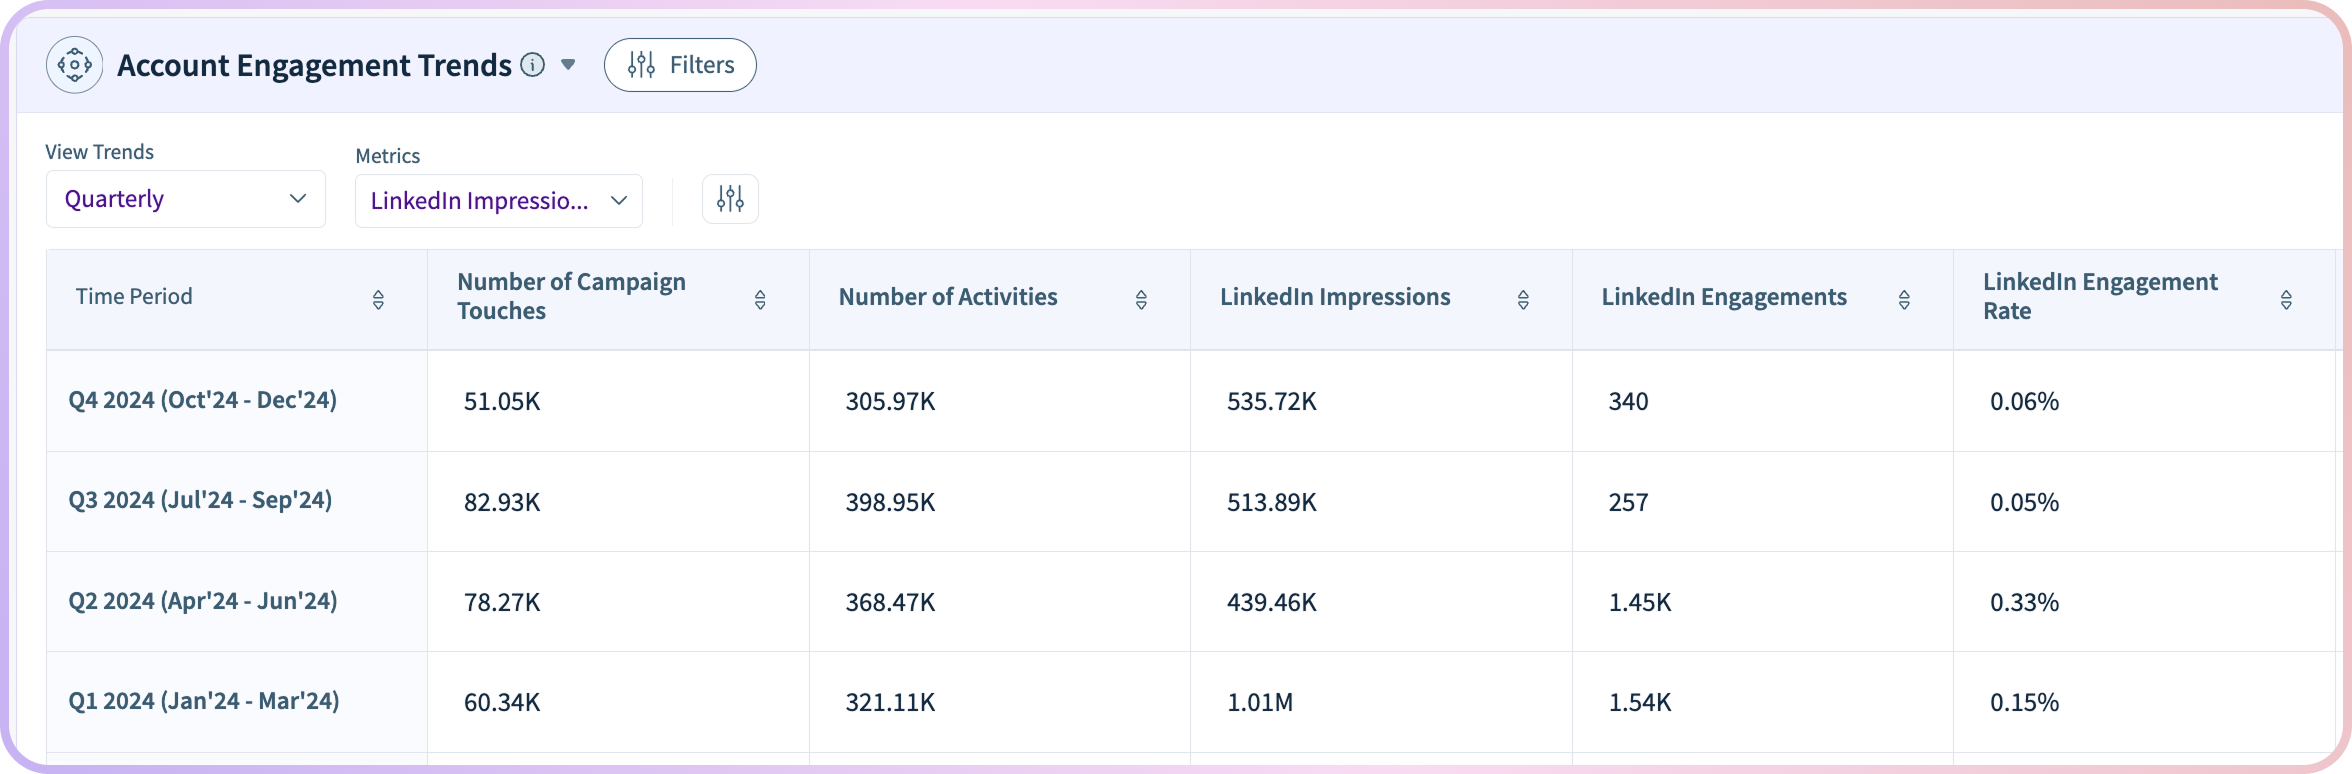
Finally, the dashboard includes account-level engagement tracking to surface intent and coverage patterns over time. Engagement trend tables combine campaign touches, activities, LinkedIn interactions, email performance, and other signals into a monthly account view.
This helps teams detect rising interest, prioritize high-activity accounts, and ensure the right accounts are receiving the right marketing coverage throughout the funnel.
The Revenue Marketing Dashboard Template helps teams move beyond lead-based reporting to a full-funnel understanding of how marketing drives pipeline and revenue. By unifying attribution, conversion progression, channel ROI, content influence, and account engagement in one place, it becomes a revenue operating system for modern B2B marketing.
Marketing leaders gain confidence in investment decisions, RevOps gains alignment across teams, and executives gain a clear view of marketing’s contribution to growth.
Next step: If you’re using RevSure, launch the Revenue Marketing Dashboard Template to connect marketing performance directly to pipeline, bookings, and ROI. If not, book a demo to see how RevSure turns marketing execution into predictable revenue outcomes.
What is a revenue marketing dashboard?
A revenue marketing dashboard is a unified reporting tool that shows how marketing activities across channels drive pipeline, bookings, and revenue outcomes across the full funnel.
How do you measure marketing’s impact on revenue?
Marketing impact is measured by tracking how campaigns and channels contribute to pipeline creation, conversion rates, bookings, and overall ROI across the funnel.
Why is full-funnel visibility important for marketing teams?
Without full-funnel visibility, teams can see top-of-funnel activity but cannot understand how it translates into pipeline and revenue, making it difficult to optimize performance and investment.
What insights does the Revenue Marketing Dashboard Template provide?
It shows marketing’s contribution to pipeline and revenue, funnel progression, conversion efficiency, channel and campaign ROI, and content influence across the buyer journey.
How does this dashboard help improve conversion across the funnel?
It identifies where leads drop off between stages, highlights conversion bottlenecks, and helps teams improve qualification, routing, and handoffs.
Who should use a revenue marketing dashboard?
Demand generation teams, marketing operations, RevOps, and executive leaders use it to align marketing performance with pipeline and revenue outcomes.
How does it track channel and campaign effectiveness?
It compares spend, pipeline generated, bookings, and ROI across channels and campaigns, helping teams identify which investments drive the highest revenue impact.
Can you measure content and website influence on pipeline?
Yes, the dashboard shows which pages, content assets, and journeys contribute to MQLs, opportunities, and pipeline creation.
How does this differ from traditional marketing dashboards?
Traditional dashboards focus on leads and engagement, while a revenue marketing dashboard connects marketing activity directly to pipeline, conversion, and revenue performance.
What metrics are most important in a revenue marketing dashboard?
Key metrics include total spend, MQLs, pipeline value, bookings, ROI, conversion rates across funnel stages, channel performance, and content-driven pipeline contribution.


