Want to see RevSure in action
Schedule a 30-minute demo
Book a Demo
Back to Templates


See exactly which content and channels are creating pipeline
Content marketing generates traffic, engagement, and downloads, but those metrics rarely answer the question leadership cares about: Which content actually drives pipeline and revenue? Without clear attribution, teams risk investing in high-visibility assets that don’t convert, while underfunding the content that quietly fuels growth.
RevSure’s Content Effectiveness Dashboard solves this by connecting content, channels, and campaigns directly to revenue outcomes. It shows how content influences sign-ups, qualified leads, and pipeline creation, so teams can confidently scale what works and cut what doesn’t.
This dashboard is designed for B2B organizations that treat content as a strategic growth lever, not just a brand function.
Demand Generation & Marketing
Understand which assets influence high-intent sign-ups and pipeline, and optimize landing pages, nurture flows, and promotional strategies accordingly.
Growth & Revenue Operations
Track how content-driven acquisition sources convert into SQLs and opportunities. Validate which content types and motions generate a durable, high-quality pipeline.
Marketing Leadership & Executives
Monitor content ROI, channel efficiency, and contribution to revenue, not just traffic or engagement metrics.
By aligning teams around shared pipeline impact, the dashboard elevates content from a marketing metric to a revenue driver.
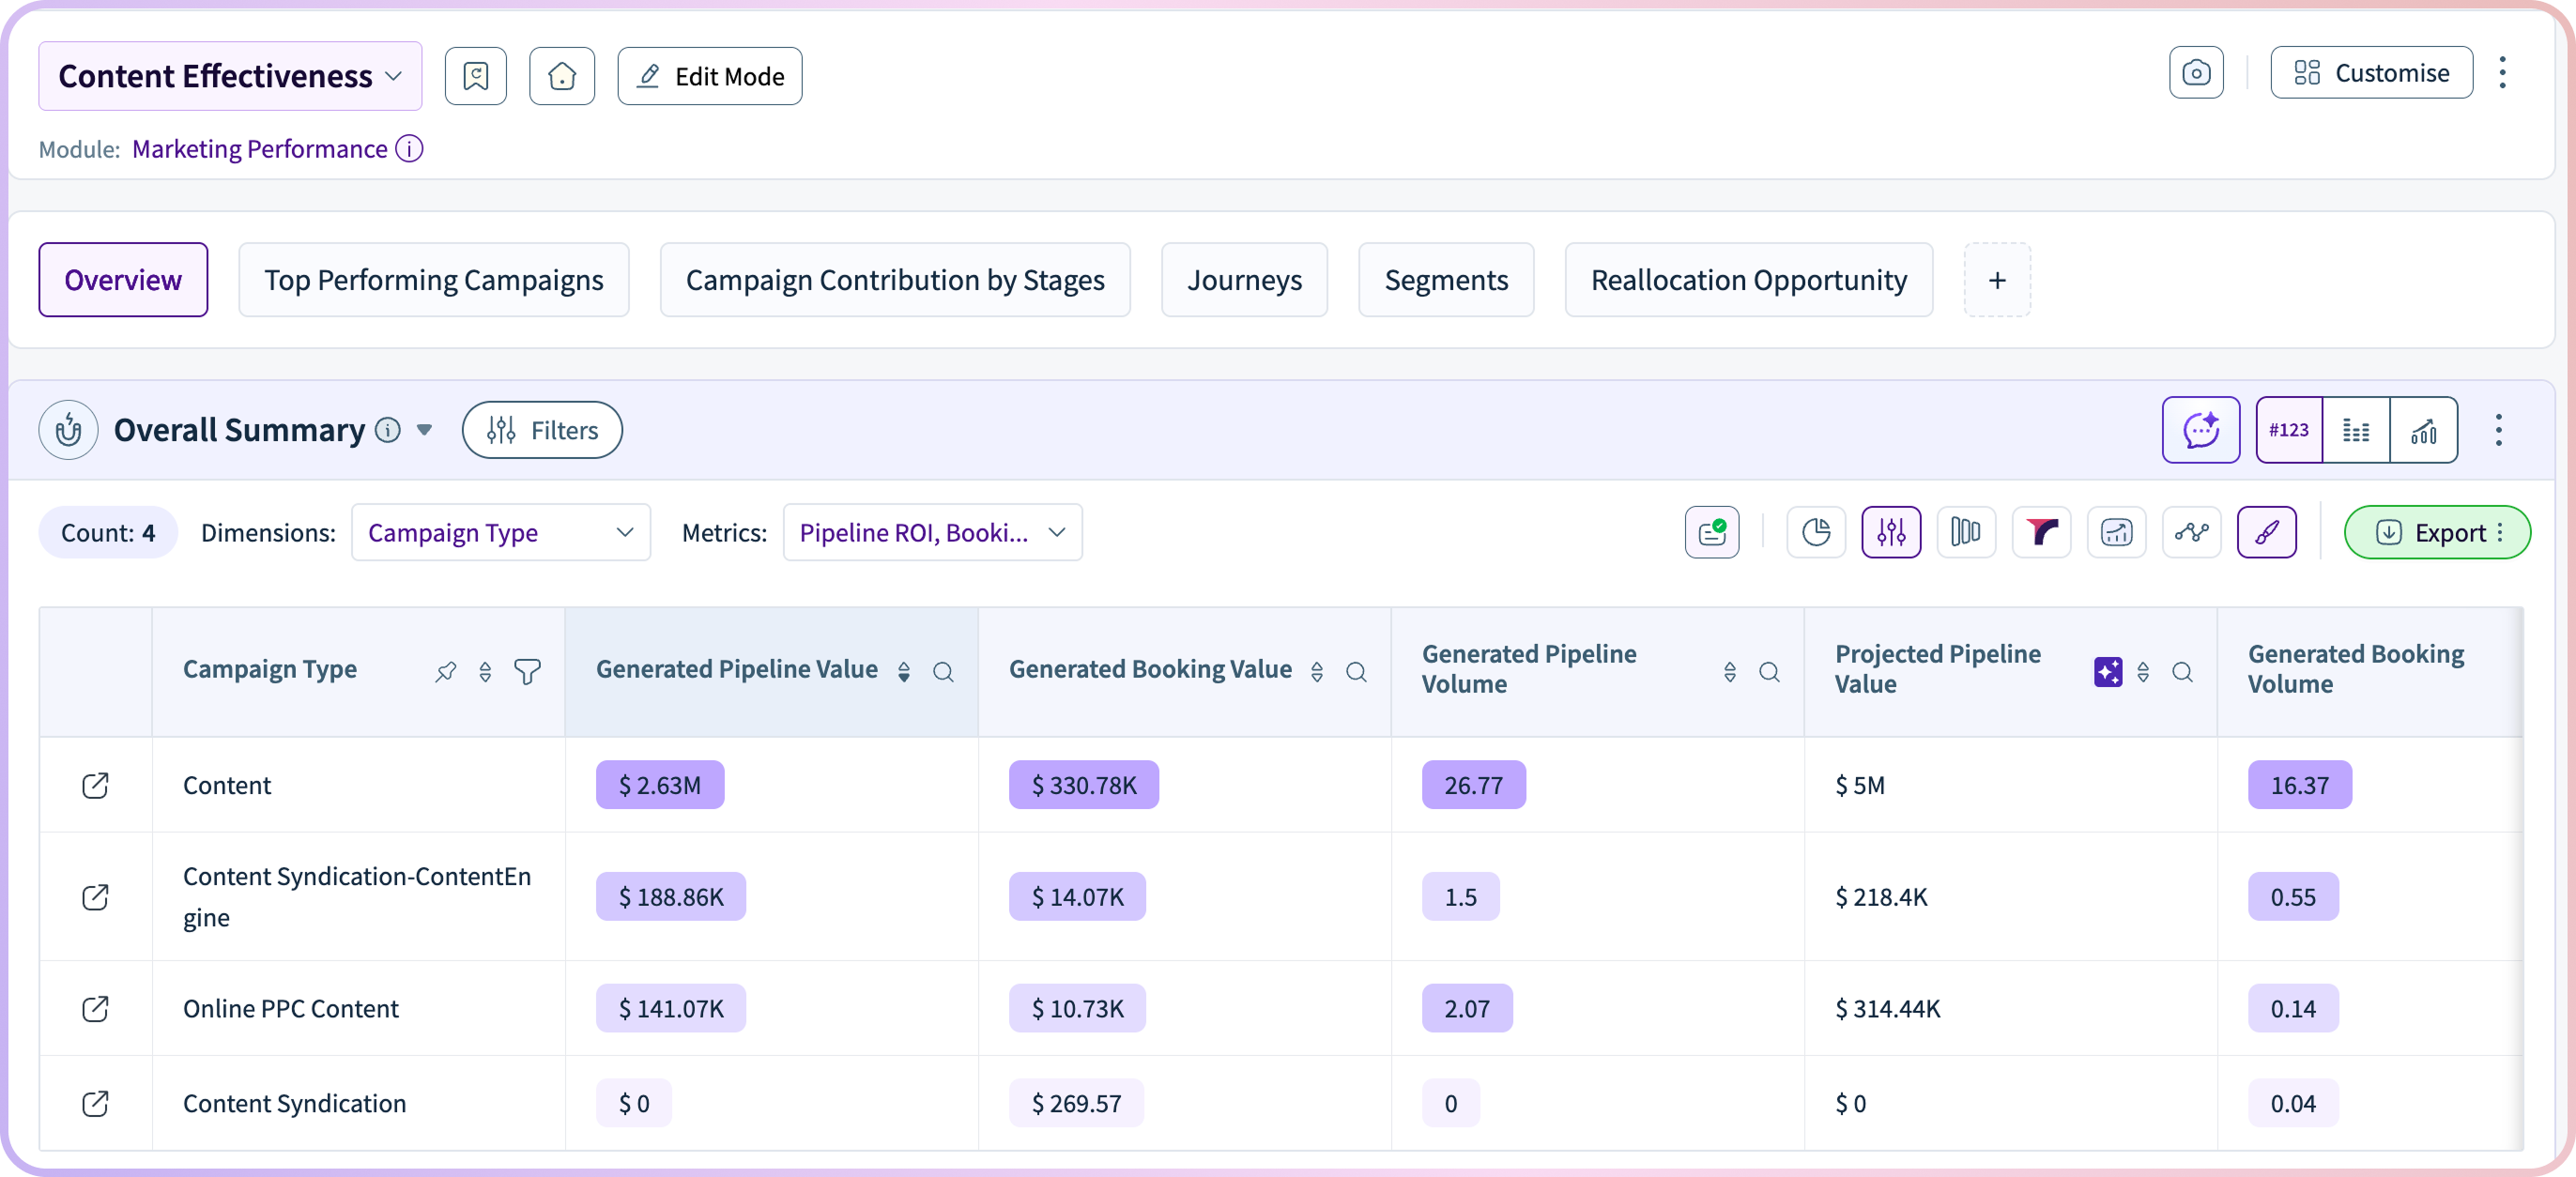
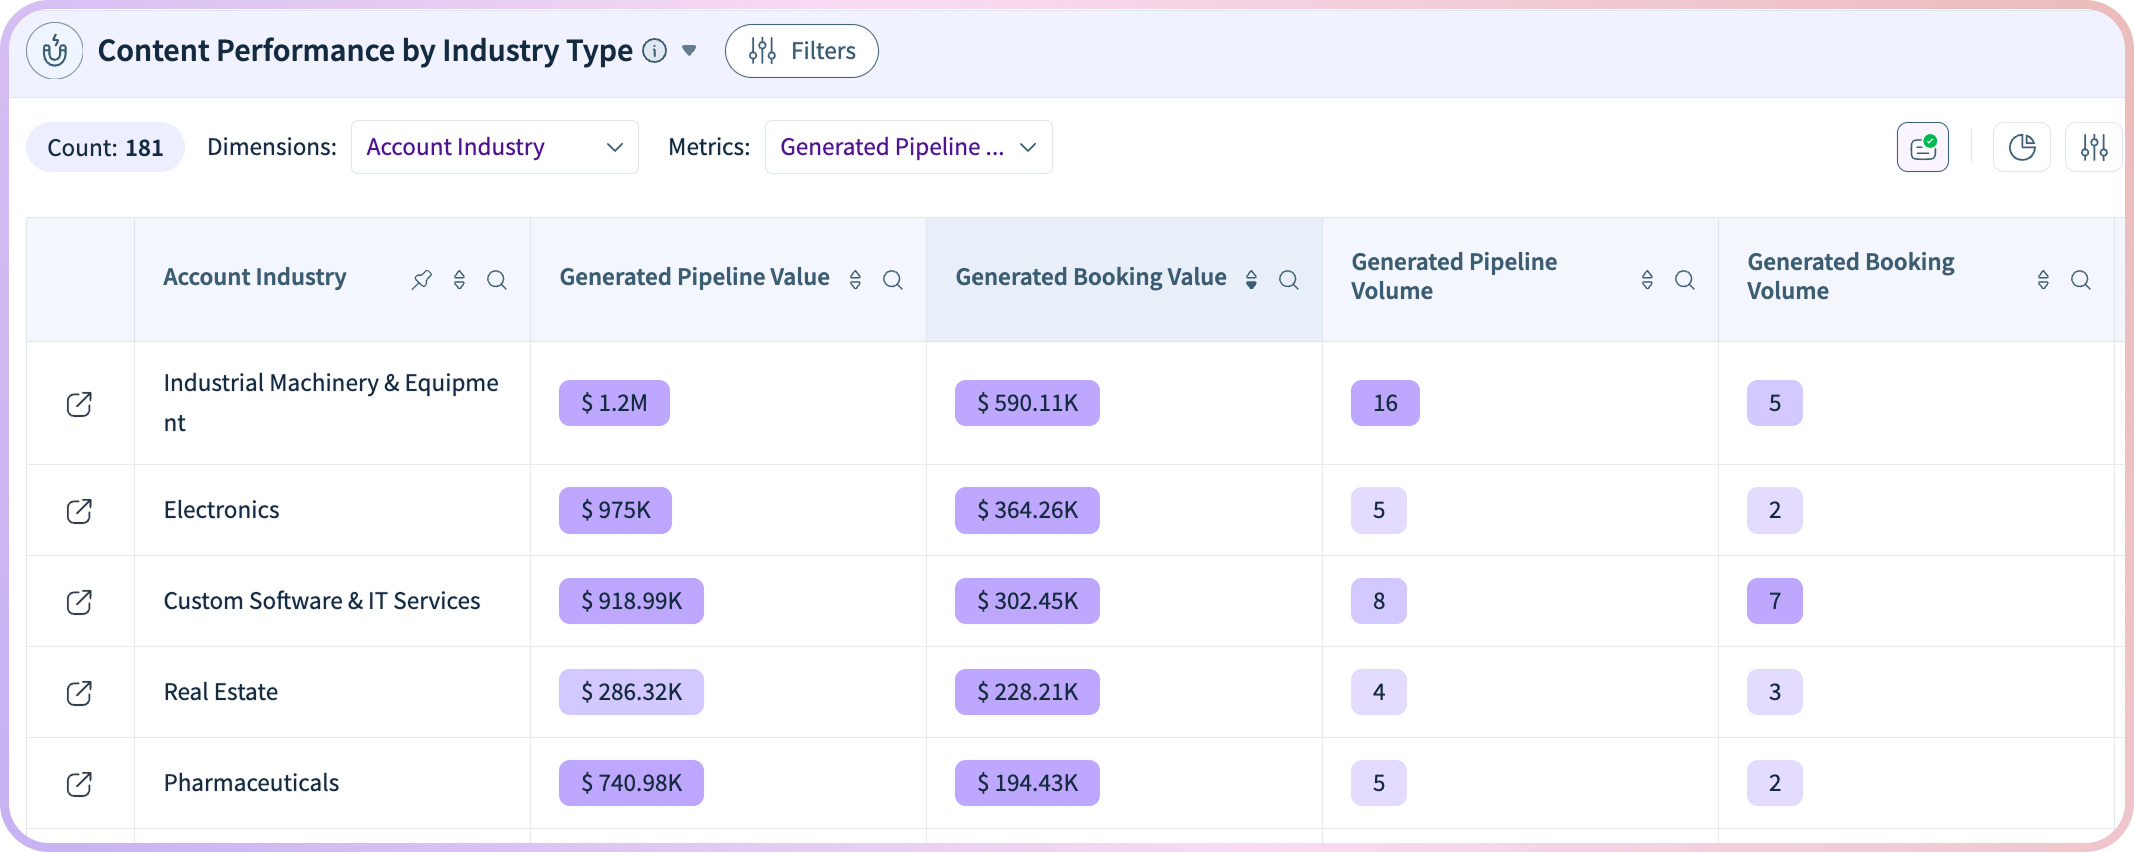
At the core of the dashboard is a purpose-built content attribution layer that connects individual assets and topics to measurable funnel outcomes.
Instead of vanity metrics, teams can see:
This makes it easier to prioritize editorial focus, double down on high-impact themes, and reallocate spend from underperforming assets.
Content rarely converts in isolation. Prospects engage with multiple assets across channels before taking action. The Content Effectiveness Dashboard maps these journeys to reveal how content sequences influence conversion.
Teams can analyze:
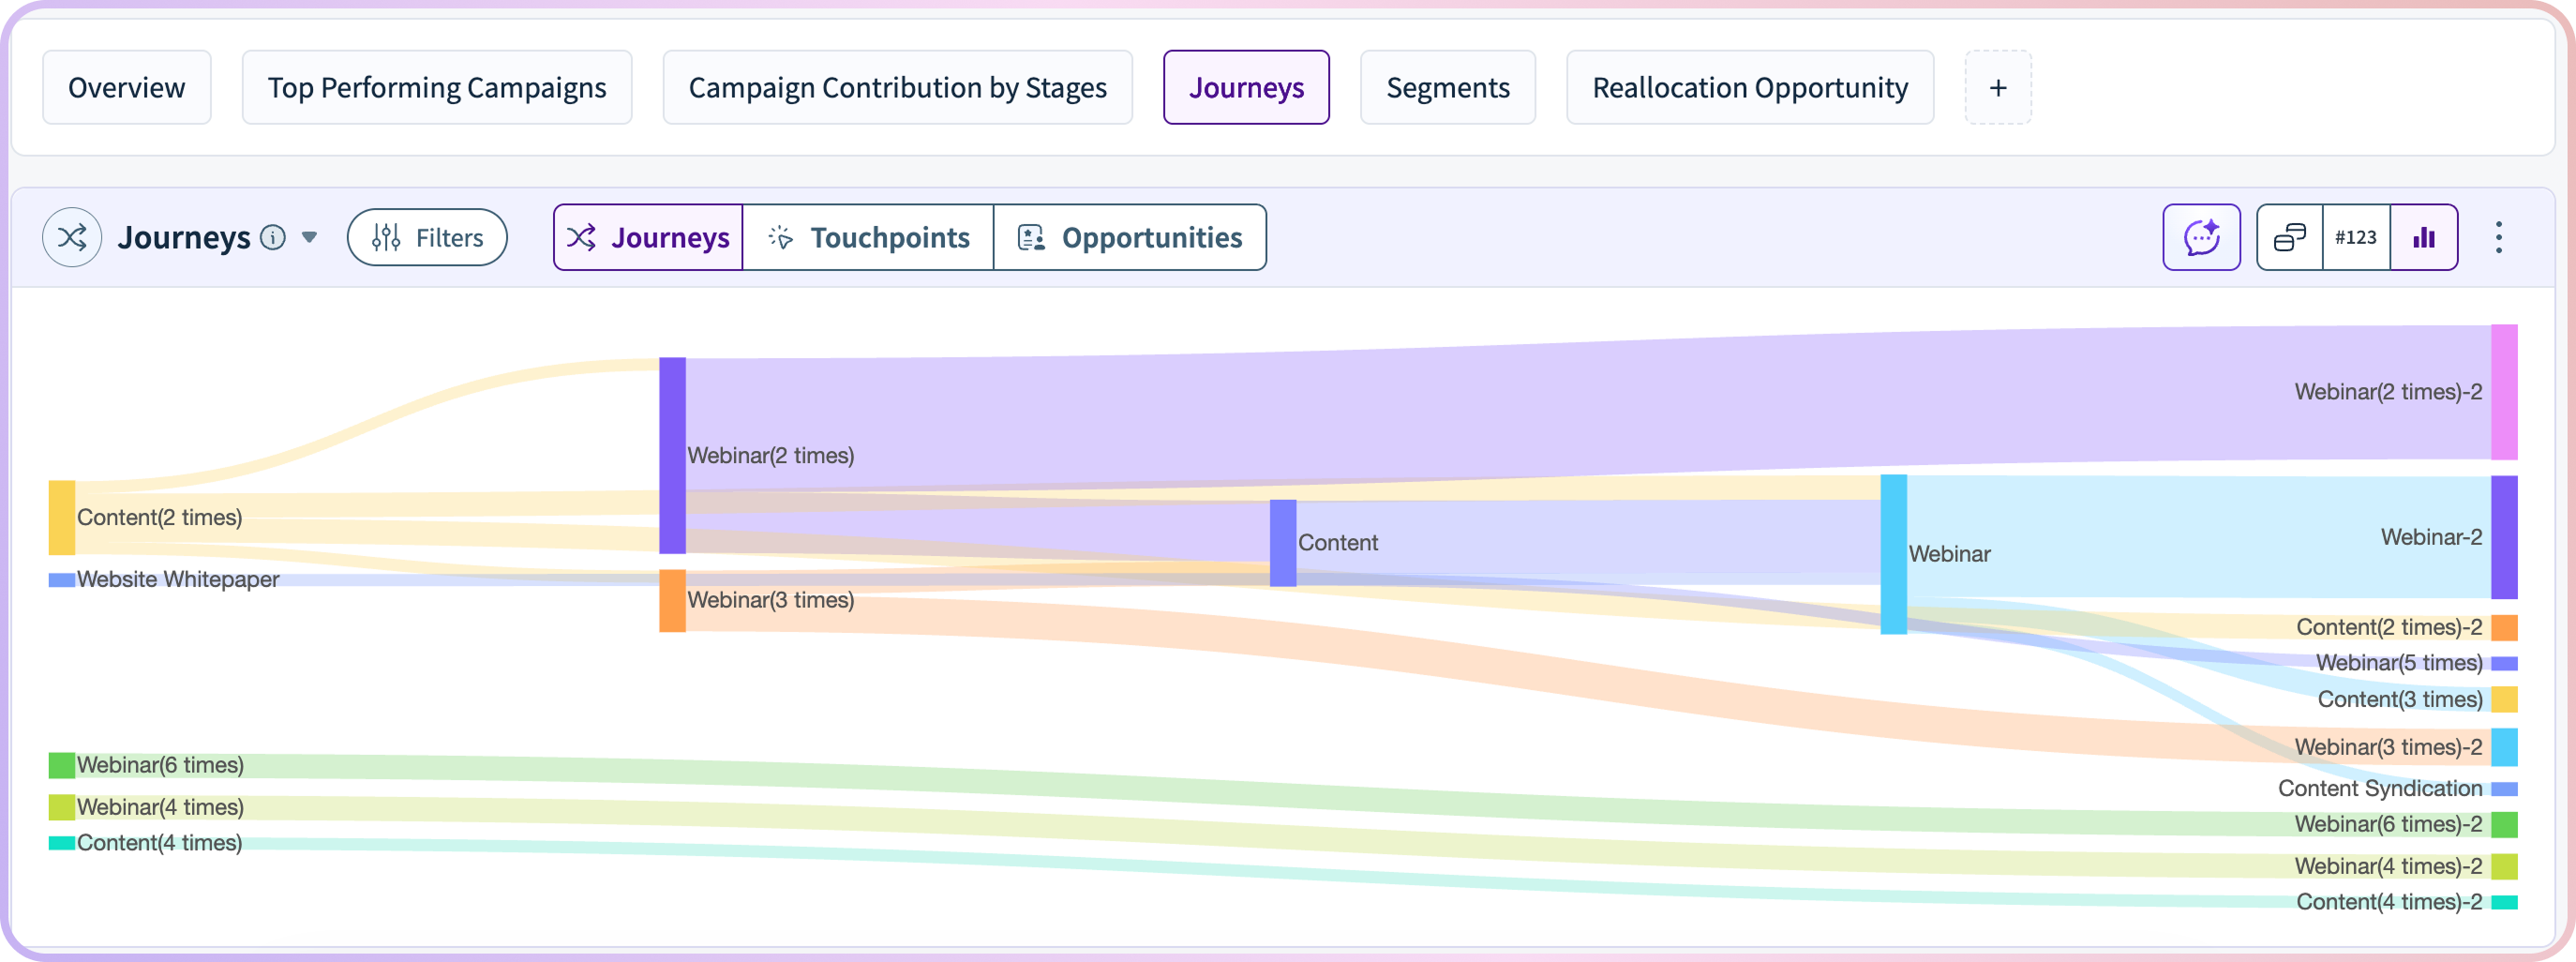
By understanding how prospects move through content before converting, teams can refine nurture strategies and design journeys that accelerate pipeline creation.
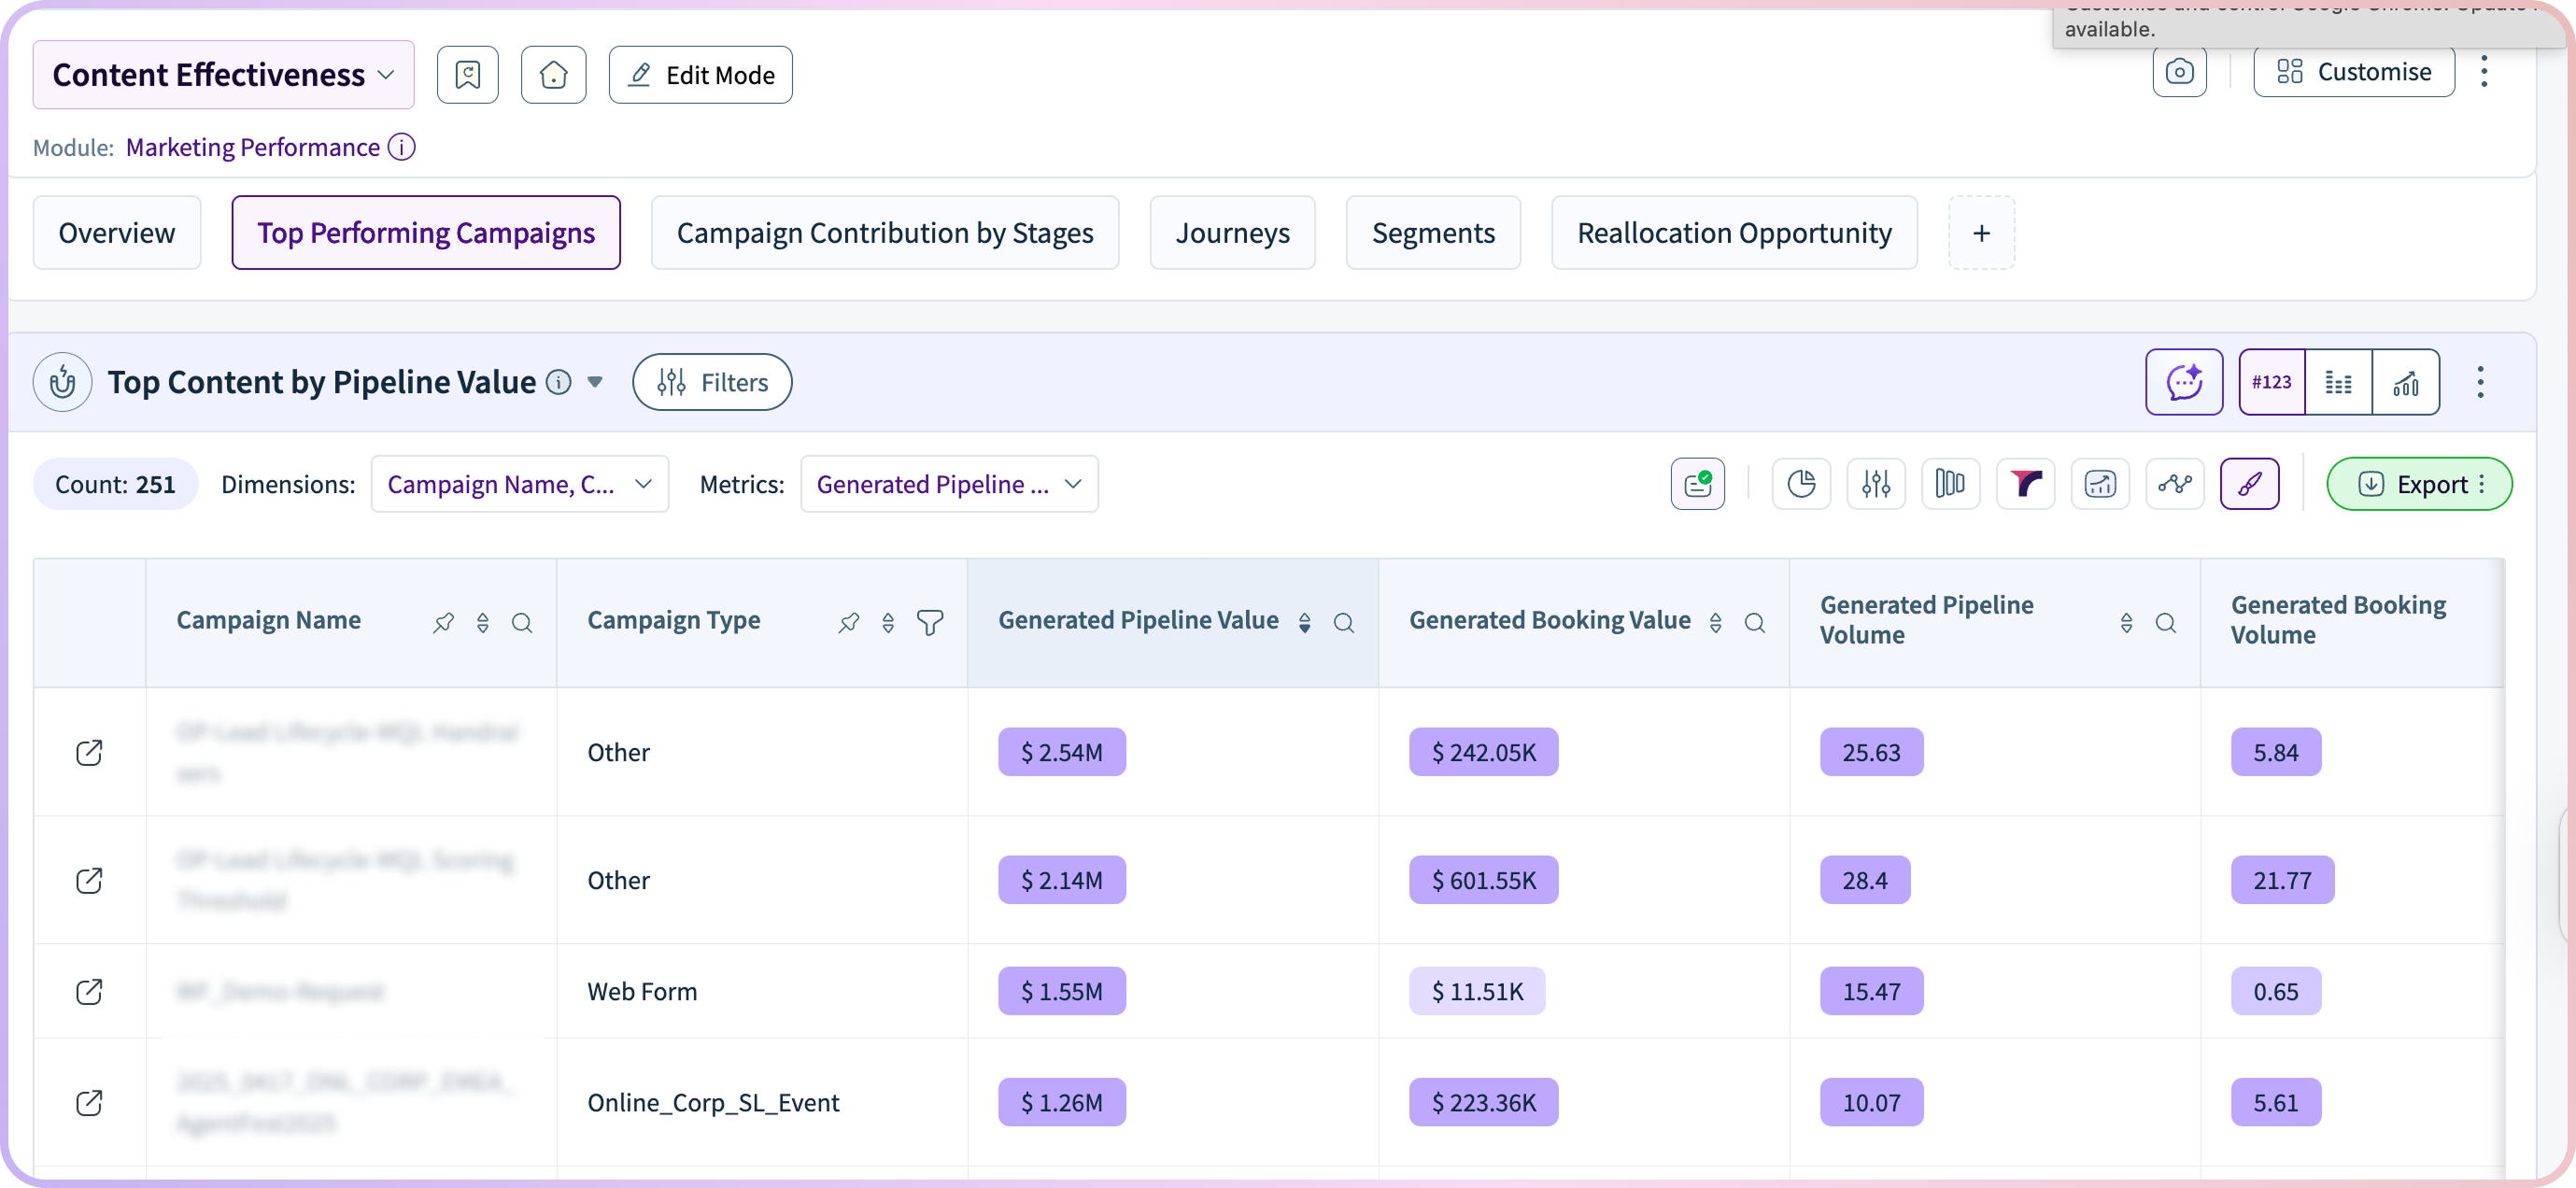
Not all channels distribute content equally effectively. The dashboard evaluates how promotion channels contribute to sign-ups and pipeline, allowing teams to identify the most efficient acquisition paths.
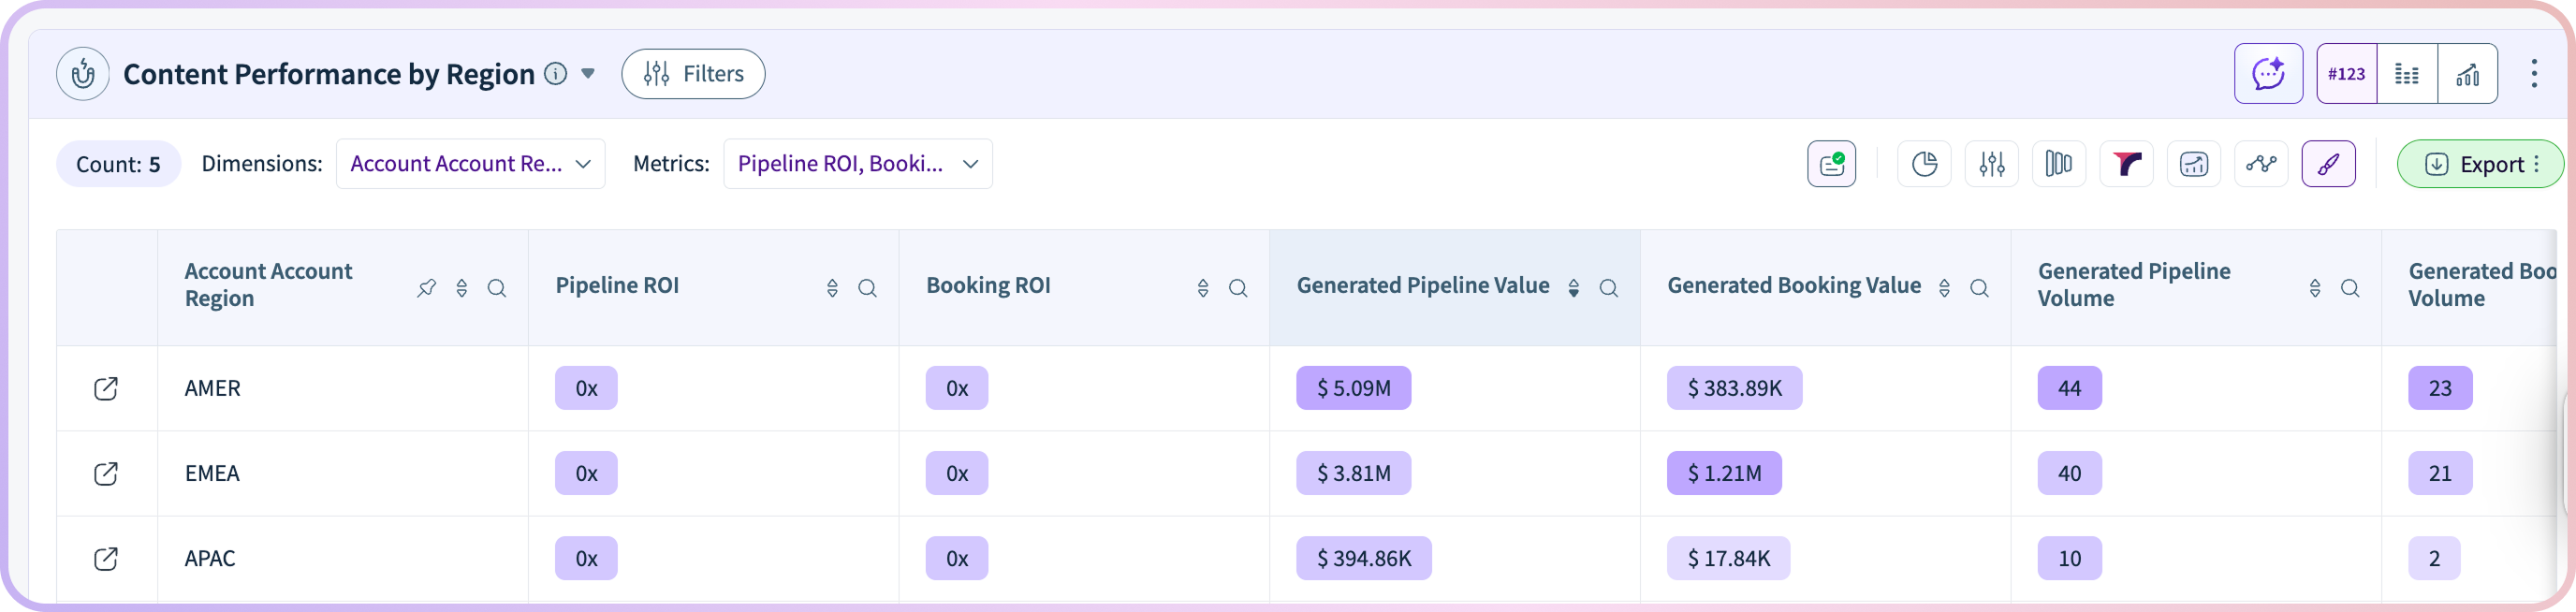
This enables smarter decisions around:
Instead of blindly scaling content, teams can optimize the specific combinations of content, channel, and campaign that consistently produce a high-quality pipeline.
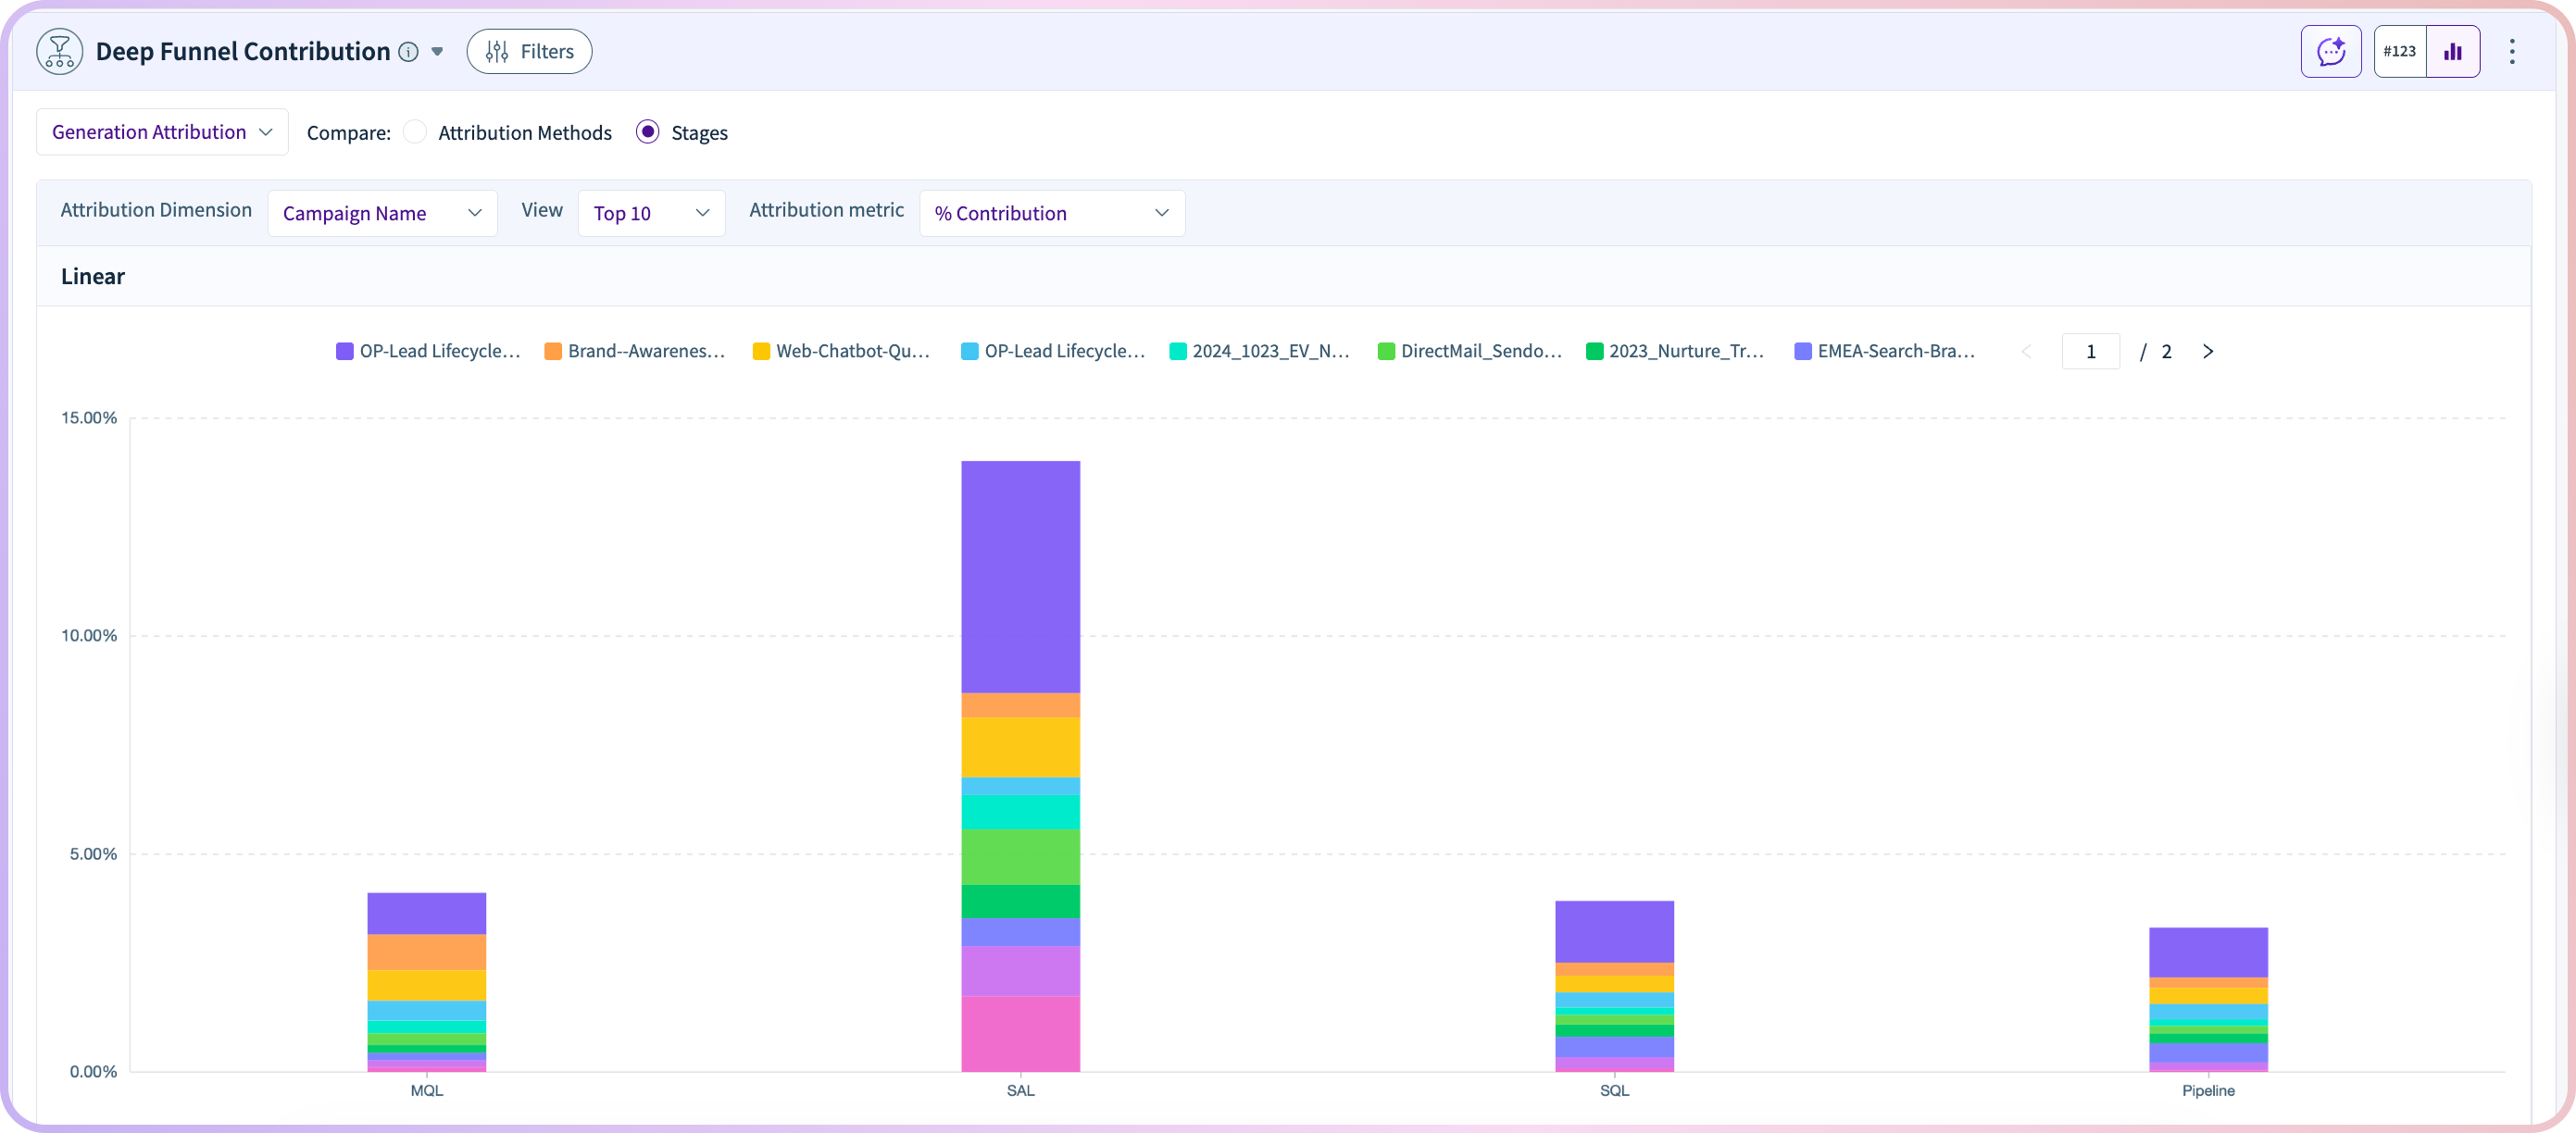
The Content Effectiveness Dashboard transforms content reporting into revenue reporting. By quantifying asset-level influence across first-touch, mid-funnel, and last-touch attribution, it aligns content strategy with GTM outcomes.
Marketing teams gain clarity on what drives the pipeline. RevOps gains confidence in attribution. Leadership gains visibility into content ROI in revenue terms.
Next step: If you’re using RevSure, activate the Content Effectiveness Dashboard to see exactly which assets are fueling pipeline growth. If not, book a demo to see how RevSure connects content performance to measurable revenue impact.
What is a content effectiveness dashboard?
A content effectiveness dashboard is a reporting tool that connects content performance to pipeline and revenue. It shows which assets, topics, and channels drive sign-ups, qualified leads, and opportunities.
How do you measure content effectiveness in B2B?
Content effectiveness is measured by its contribution to sign-ups, SQLs, and pipeline, rather than just engagement metrics like traffic or downloads.
Why are traditional content metrics not enough?
Traditional metrics like page views and downloads show engagement but do not indicate whether content is driving pipeline or revenue, making it hard to prioritize high-impact assets.
What insights does the Content Effectiveness Dashboard provide?
It shows which content assets and topics drive pipeline, how content contributes to SQLs and opportunities, and which channels generate high-quality leads.
How does content contribute to pipeline generation?
Content influences multiple stages of the buyer journey by educating prospects, driving sign-ups, and supporting conversions through a sequence of interactions across channels.
Who should use a content effectiveness dashboard?
Demand generation teams, marketing leaders, RevOps, and growth teams use it to understand which content drives revenue and to optimize content strategy.
How does this differ from traditional content analytics tools?
Traditional tools focus on engagement metrics, while a content effectiveness dashboard connects content performance directly to revenue outcomes and pipeline impact.
Can you track content performance across channels and campaigns?
Yes, the dashboard tracks how different channels and campaigns distribute content and contribute to sign-ups, SQLs, and pipeline creation.
How does the dashboard analyze content journeys?
It maps how prospects interact with multiple content assets across channels before converting, helping teams identify high-converting paths and optimize nurture flows.
What metrics should you track to evaluate content performance?
Key metrics include sign-ups driven by content, SQLs, pipeline contribution, conversion rates, and the effectiveness of content across different channels and funnel stages.


