Want to see RevSure in action
Schedule a 30-minute demo
Book a Demo
Back to Templates


Real-time visibility into pipeline health, velocity, conversion efficiency, and win-rate trends
GTM performance suffers when teams work in silos. Marketing tracks campaign activity, sales notices stalled deals, RevOps spots inconsistent funnel metrics, and leadership sees unreliable forecasts. Without a shared view of pipeline health and execution, teams often react too late, putting revenue targets at risk.
RevSure’s GTM Performance Dashboard Template solves this problem by giving sales, marketing, and revenue leaders a real-time view of funnel performance. It highlights pipeline strength, movement, SQL quality, and win-rate trends, helping teams move from scattered reports to working together on GTM strategy.
This template is made for B2B organizations with complex go-to-market strategies, including inbound, outbound, ABM, PLG, and partner channels. GTM leaders, Sales Ops, Demand Gen, and executives use it to stay aligned on what drives performance and where to focus their efforts.
By bringing pipeline coverage, velocity, conversion quality, and outcomes into one view, the GTM Performance Dashboard Template helps teams identify what’s working, where performance is slipping, and how to course-correct quickly.
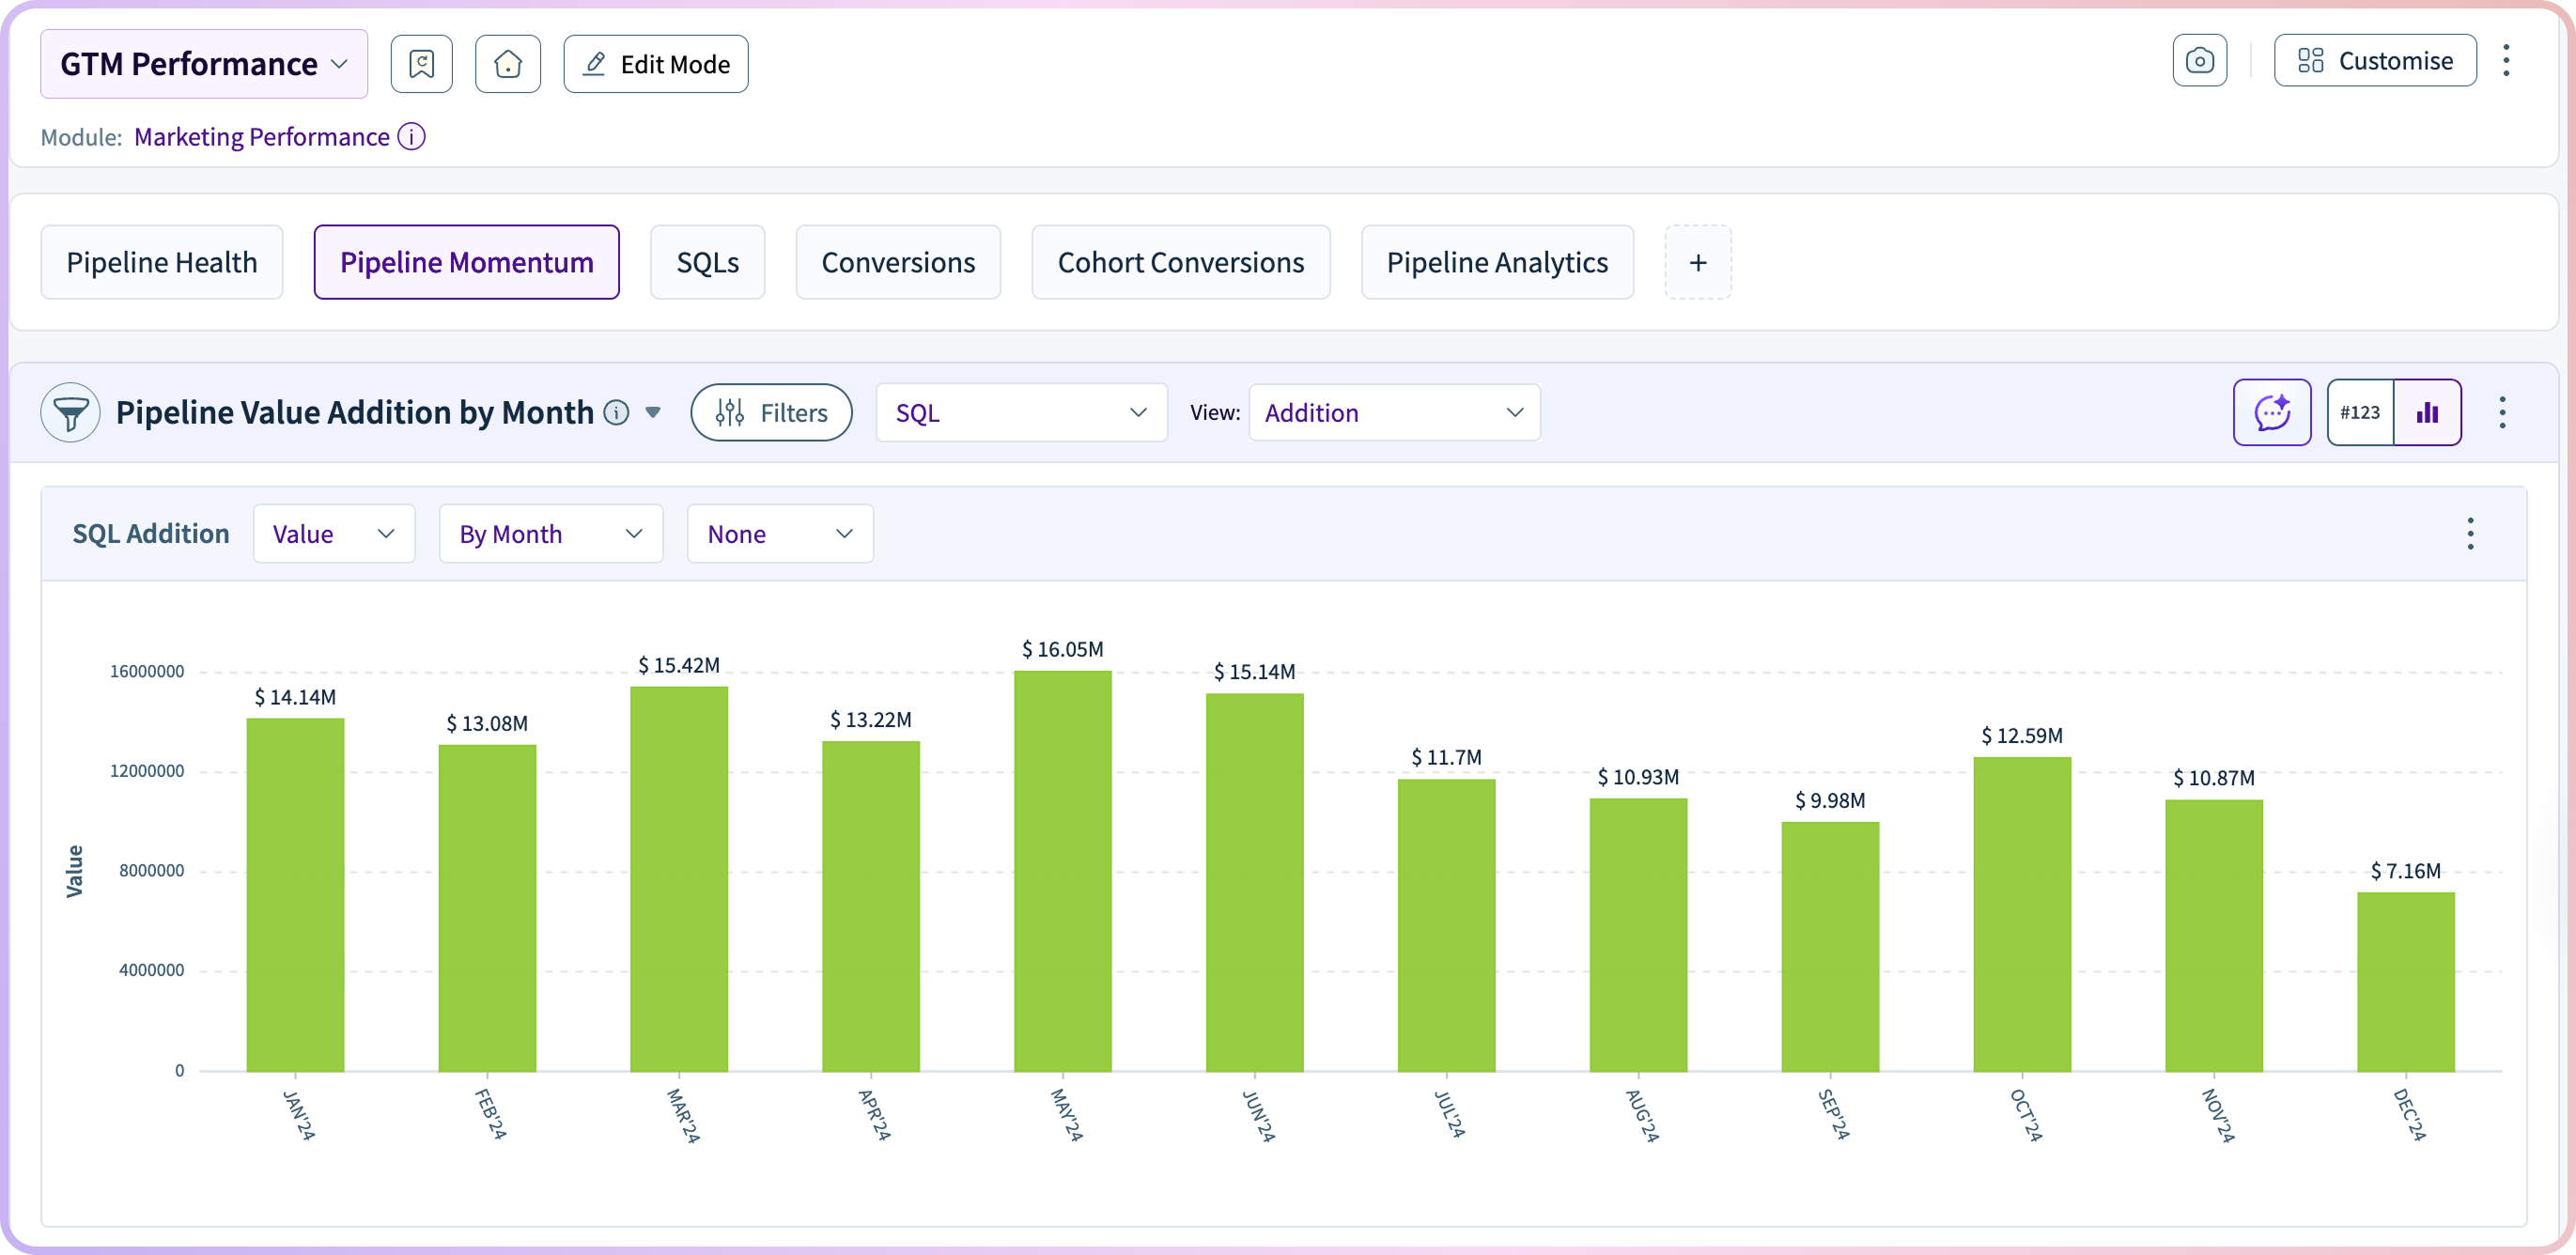
The dashboard gives you a clear look at pipeline strength and progress. Teams can check if the pipeline is big enough, balanced across stages, and moving fast enough to meet revenue goals.
This view helps teams quickly answer questions like:

By spotting coverage gaps early, GTM leaders can focus on the right markets, accounts, and strategies before results are affected.
The dashboard also tracks how efficiently accounts and opportunities move through the funnel. Insights on conversion and speed show where there are bottlenecks, process gaps, or coaching needs that impact revenue.
Key signals include:
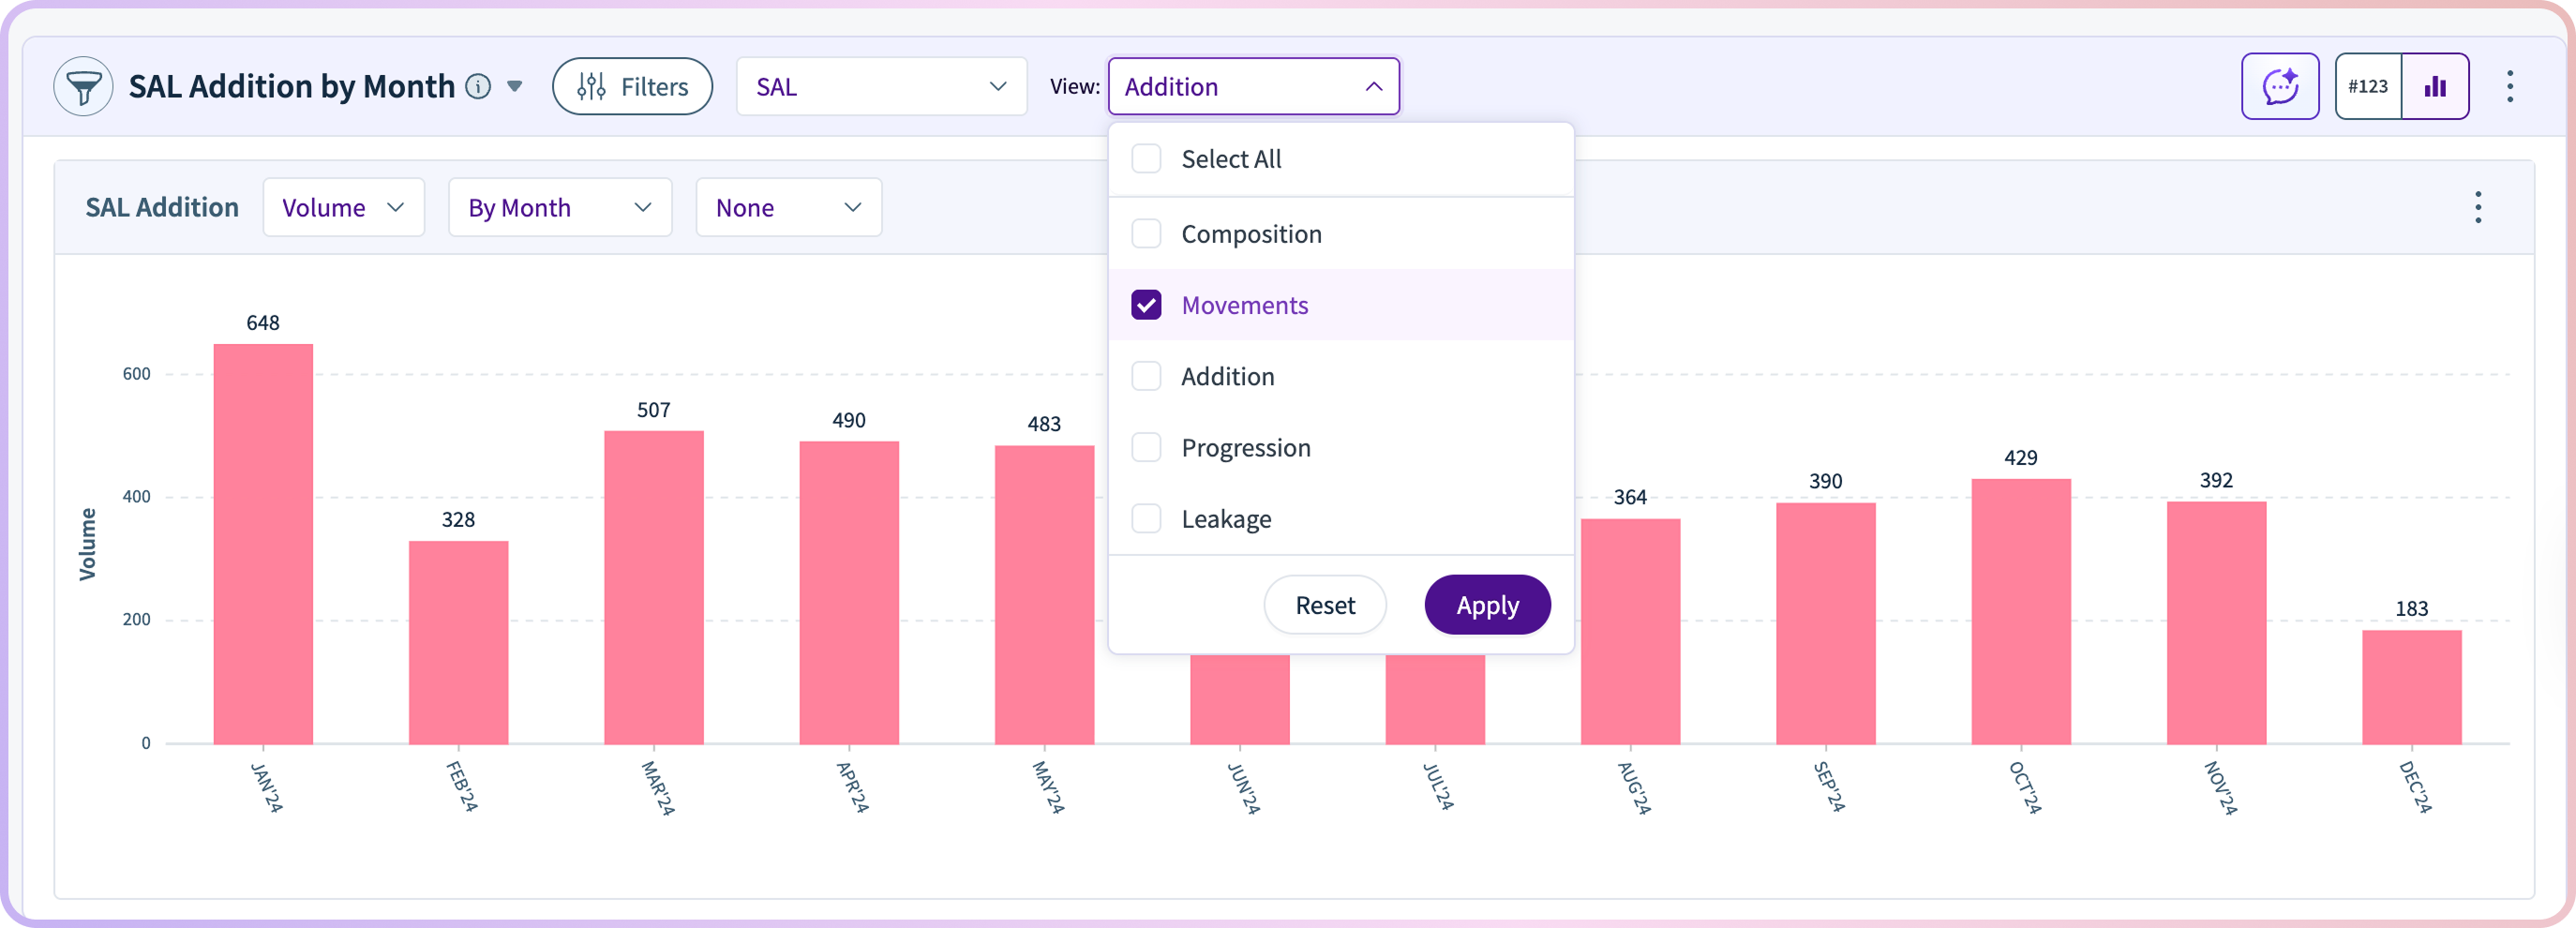
Instead of relying on lagging indicators, teams can pinpoint where execution is slowing down and improve follow-up, routing, and qualification in real time.
The GTM Performance Dashboard also checks the quality of funnel inputs and results. Cohort and SQL quality views show which sources and segments bring in high-intent opportunities and which just add noise.
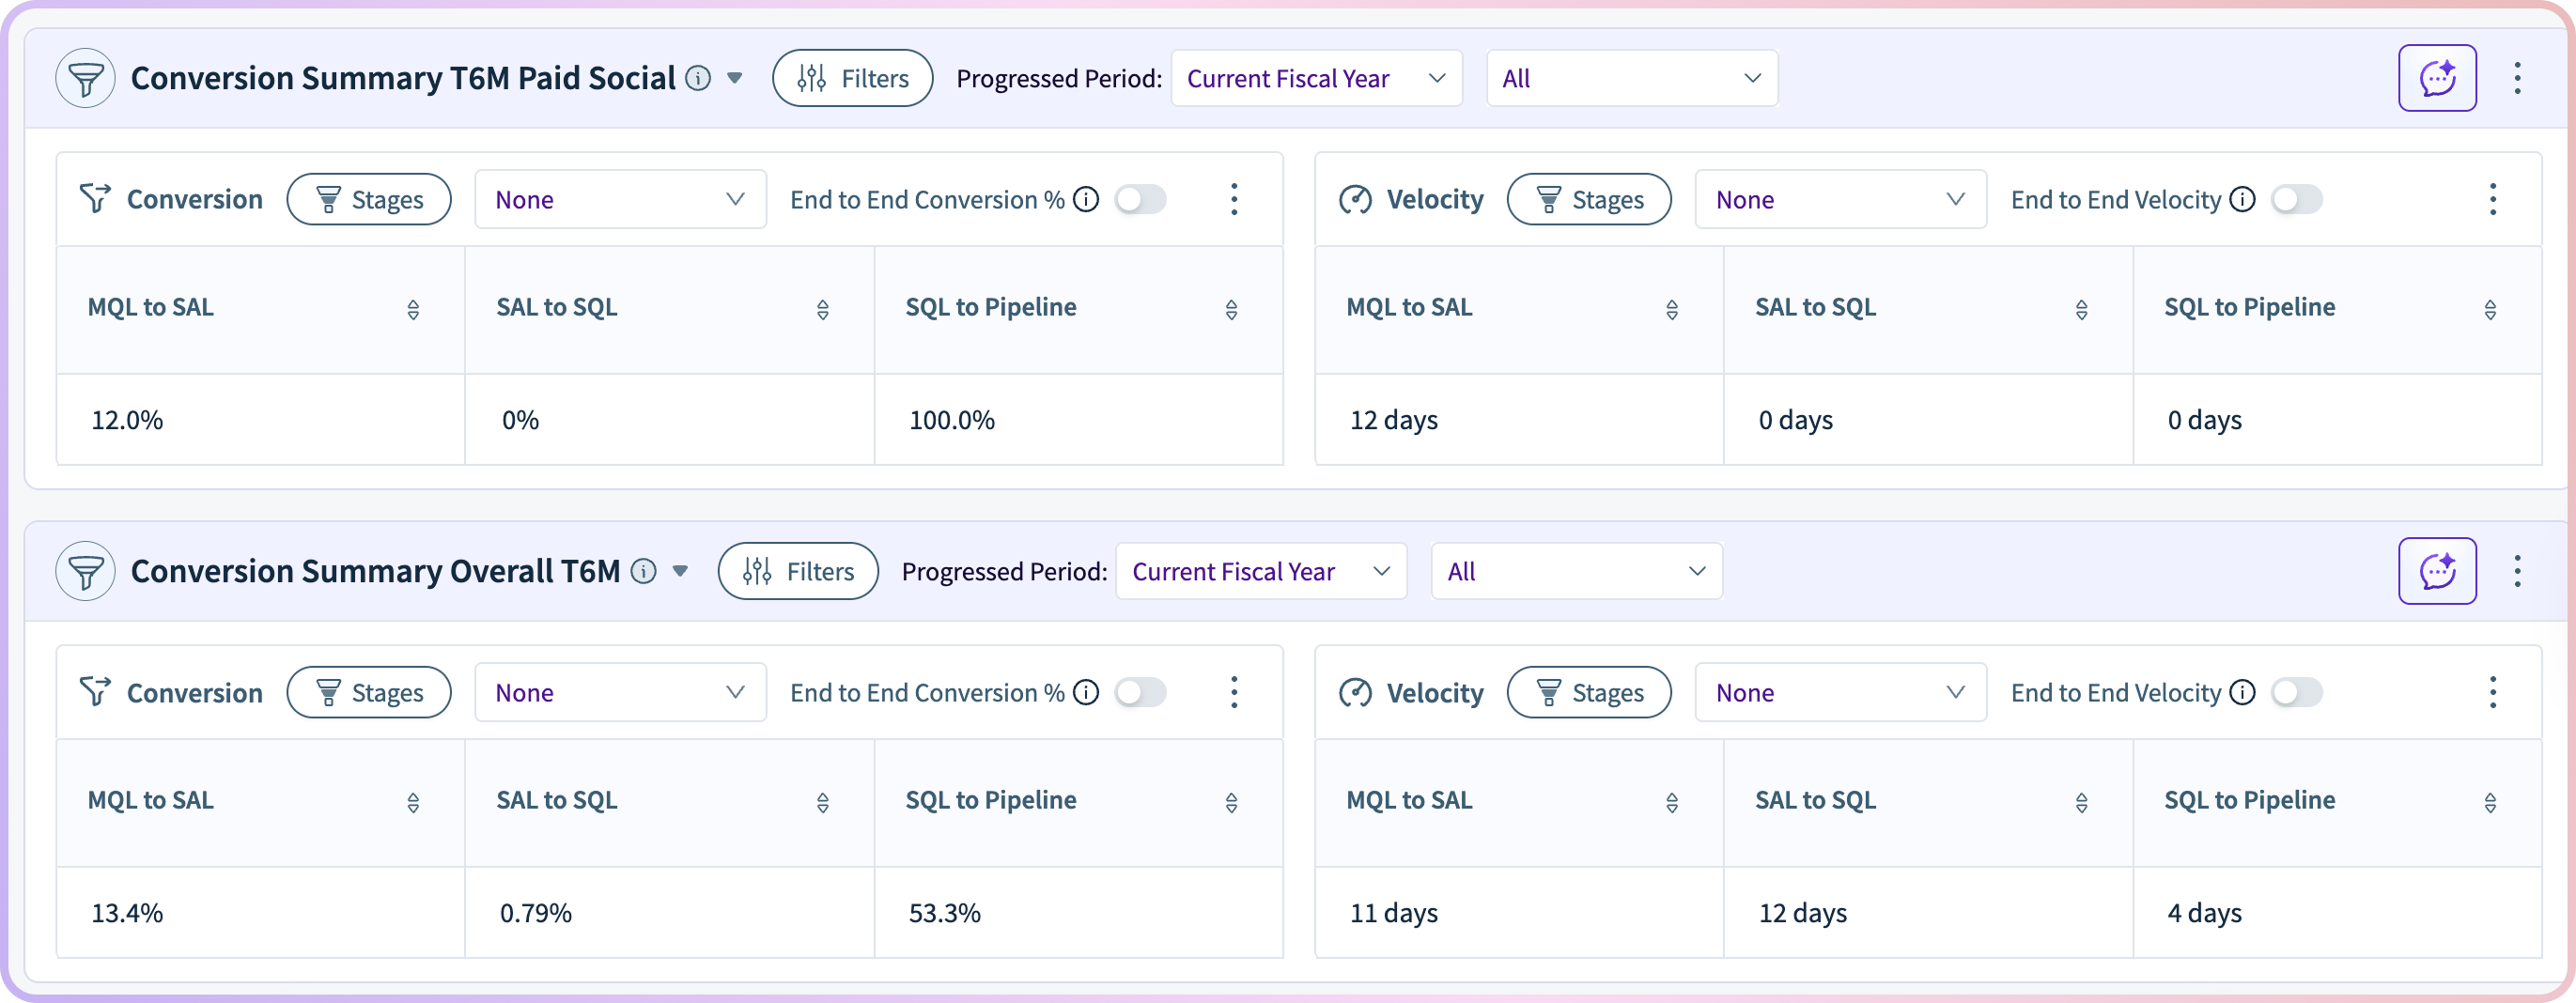
The dashboard also tracks win-rate and outcome trends over time, including loss reasons and closed-won composition. This helps GTM leaders make smarter strategic decisions about positioning, enablement, channel investment, and segment focus based on real performance data.

The GTM Performance Dashboard Template lets teams move past scattered metrics and see the whole revenue process in one place. With pipeline health, velocity, conversion efficiency, cohort quality, and win-rate outcomes together, teams can make decisions faster and grow more predictably.
Sales focuses on the right opportunities. Marketing invests in the most effective motions. RevOps identifies friction early. Leadership gains confidence in forecast accuracy and pipeline capacity—all without manual reporting or misalignment.
Next step: If you’re using RevSure, launch the GTM Performance Dashboard Template to align your go-to-market team around real-time funnel performance and execution. If not, book a demo to see how RevSure turns GTM visibility into predictable revenue growth.
What is a GTM performance dashboard?
A GTM performance dashboard is a unified reporting tool that shows pipeline health, funnel velocity, conversion efficiency, and win-rate trends across marketing, sales, and revenue teams.
How do you measure GTM performance in B2B?
GTM performance is measured using metrics like pipeline coverage, conversion rates, sales velocity, win rates, and the quality of leads and opportunities across the funnel.
Why do GTM teams struggle with pipeline visibility?
GTM teams often work in silos with separate tools and metrics, making it difficult to get a consistent view of pipeline health, performance, and revenue outcomes.
What insights does the GTM Performance Dashboard Template provide?
It shows pipeline strength, stage distribution, funnel velocity, conversion efficiency, SQL quality, and win-rate trends to help teams understand overall GTM performance.
How does this dashboard help improve pipeline health?
It highlights gaps in pipeline coverage, identifies stalled or aging deals, and shows whether pipeline is balanced and strong enough to meet revenue targets.
Who should use a GTM performance dashboard?
GTM leaders, Sales Ops, Demand Generation teams, RevOps, and executives use it to align on performance, improve execution, and drive predictable revenue growth.
How does it track funnel velocity and conversion efficiency?
It measures stage-to-stage conversion rates, time spent in each stage, and overall sales cycle length to identify bottlenecks and improve funnel movement.
Can you compare different GTM motions like inbound, outbound, and ABM?
Yes, the dashboard compares performance across different motions and channels to identify which strategies drive the best pipeline and conversion outcomes.
How does this differ from traditional pipeline reporting?
Traditional reports focus on static pipeline numbers, while a GTM performance dashboard provides real-time insights into pipeline movement, efficiency, and execution quality.
What metrics are most important for GTM performance?
Key metrics include pipeline coverage, conversion rates, velocity, deal cycle length, win rates, SQL quality, and performance by channel or GTM motion.