Product
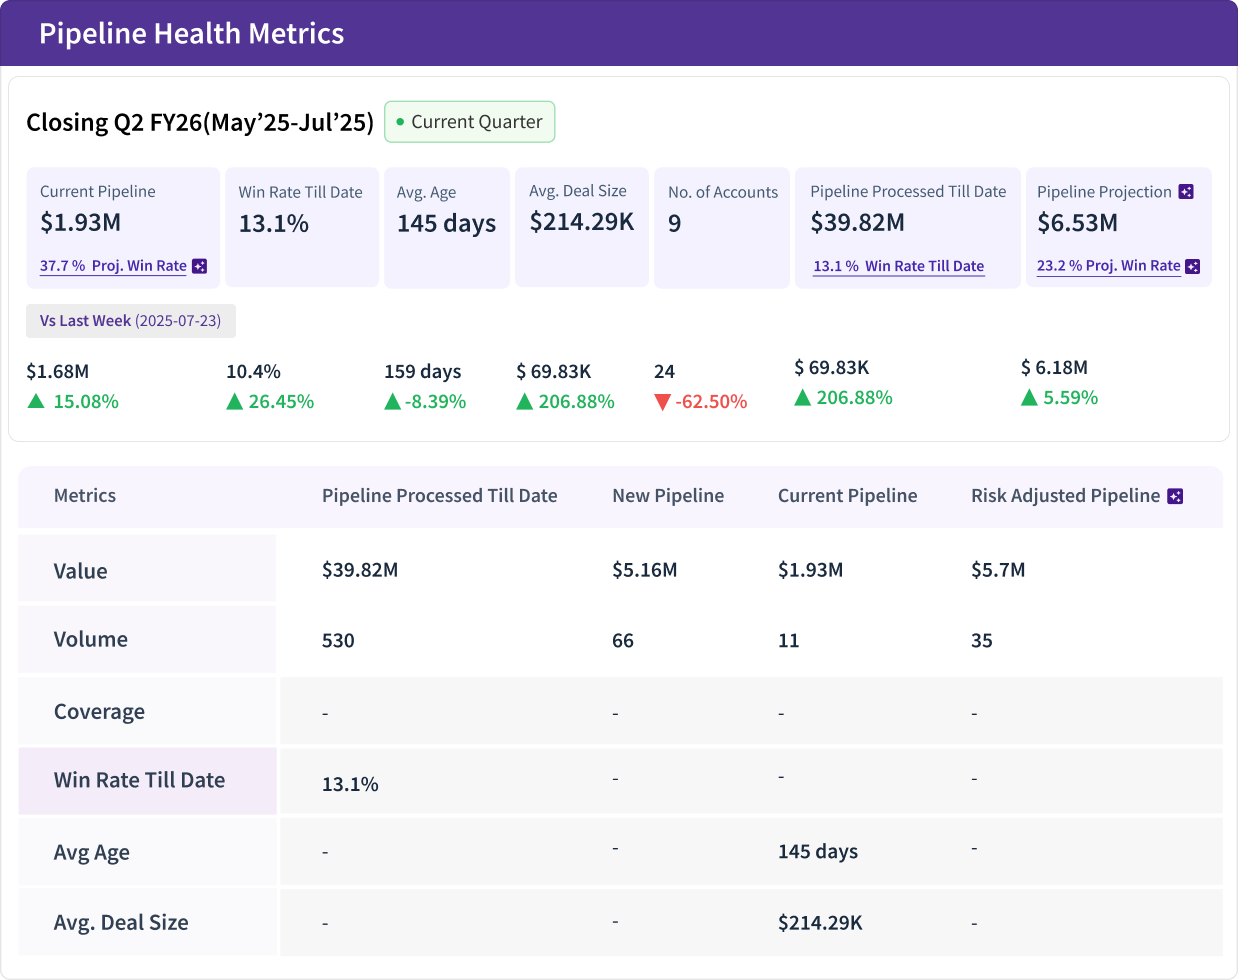
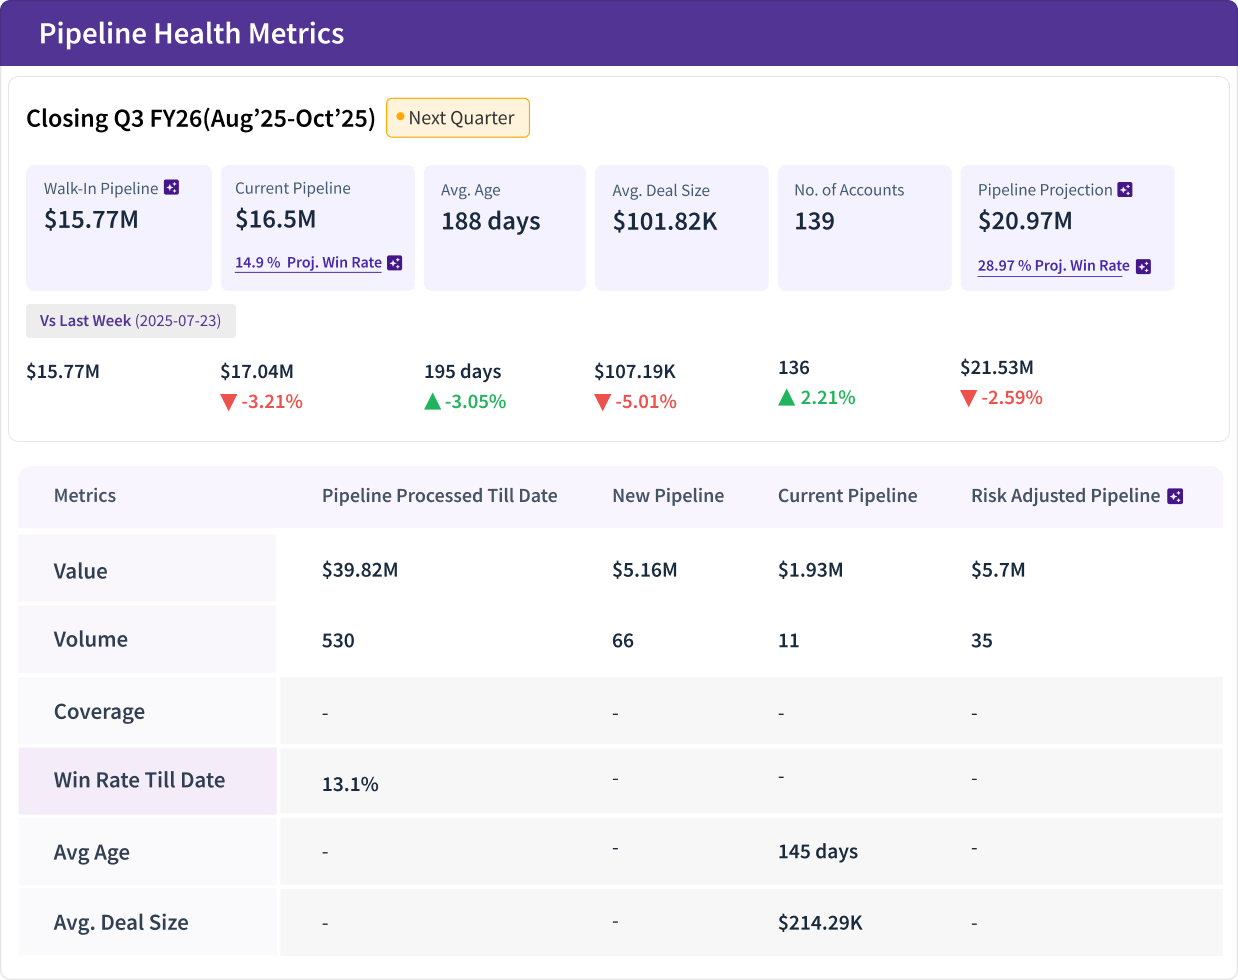
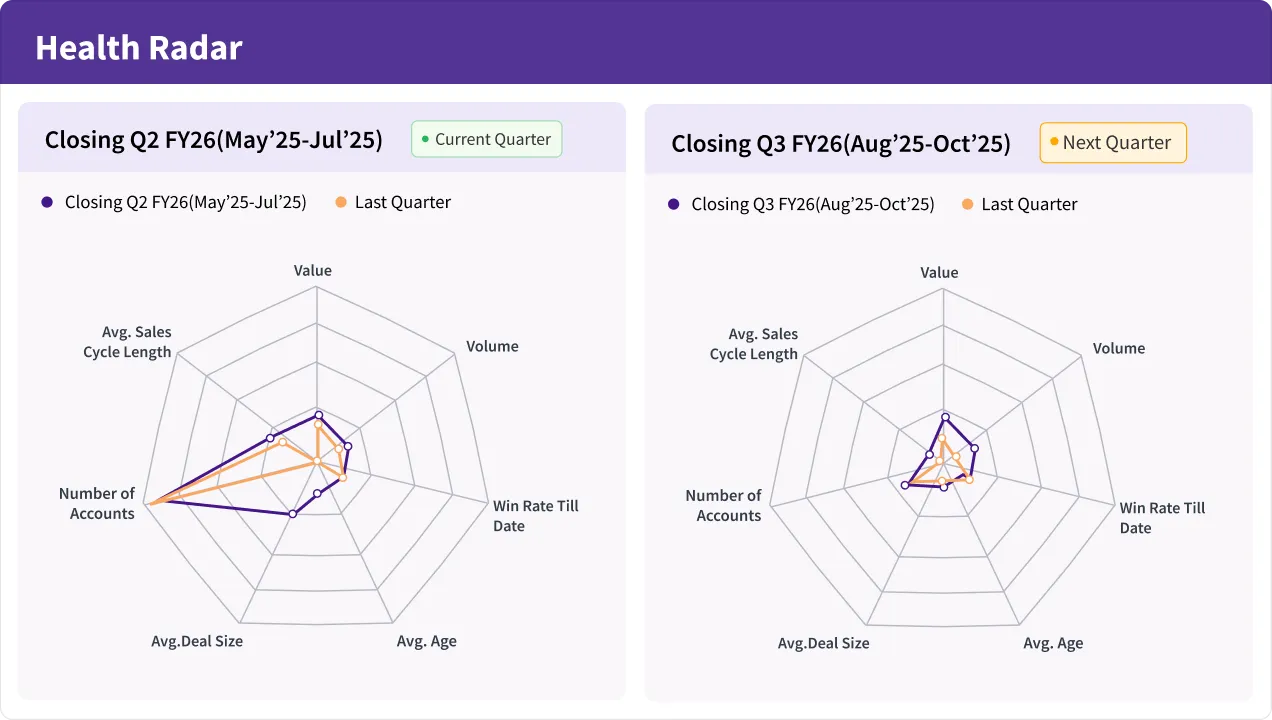
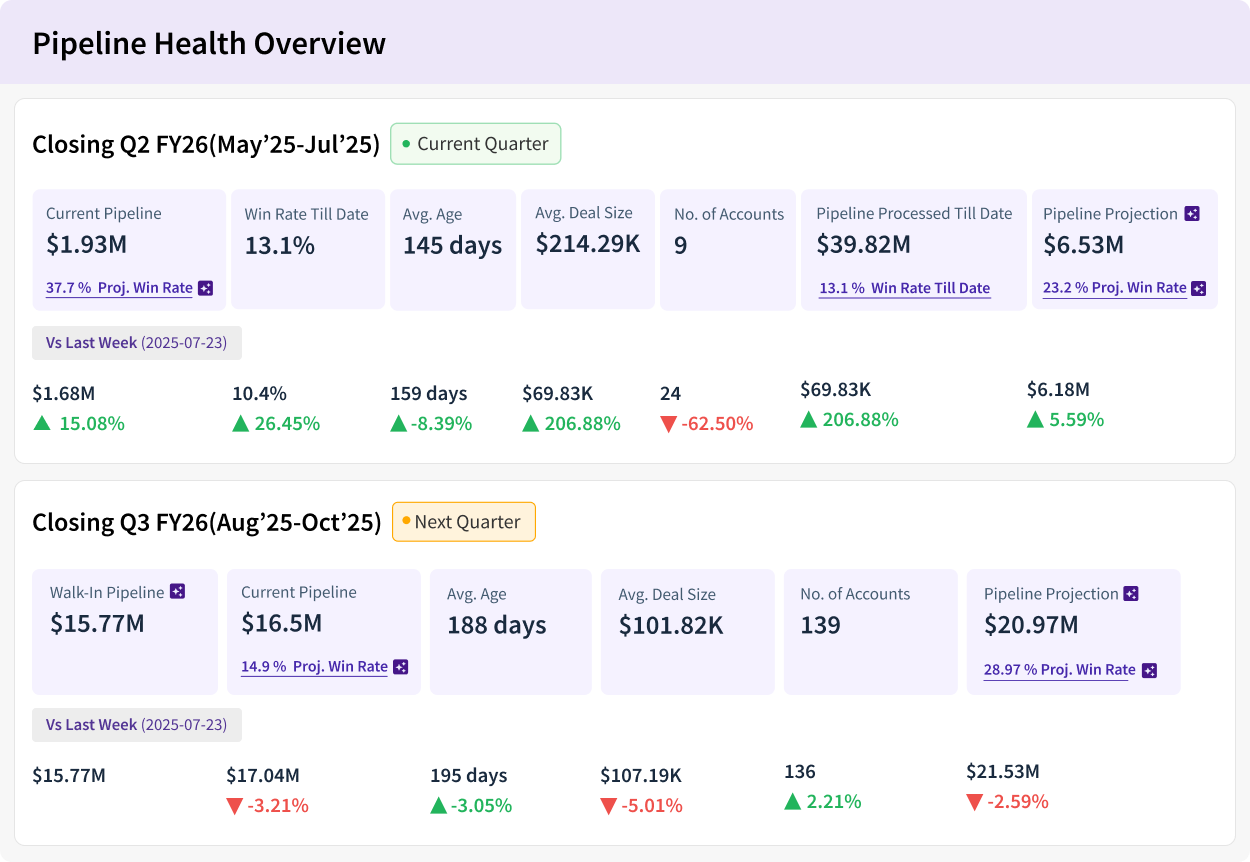
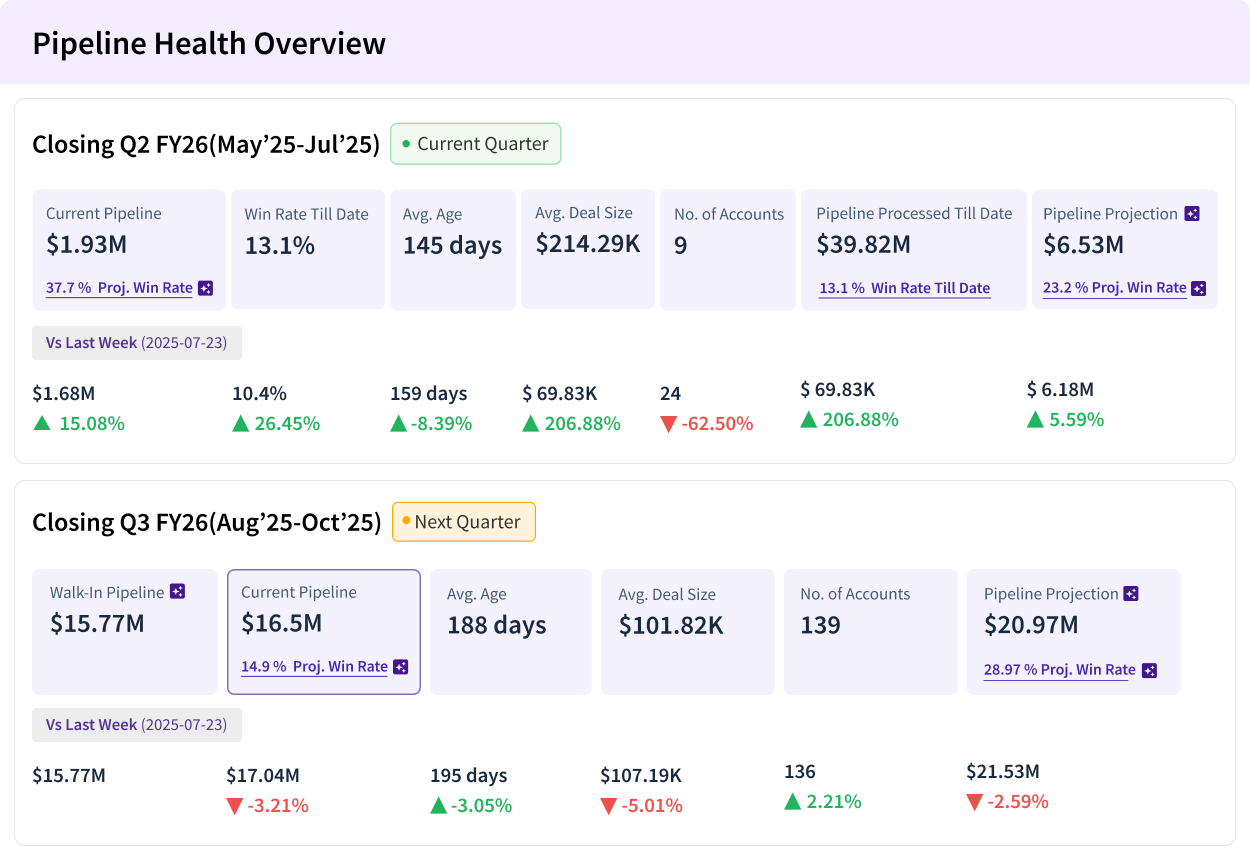
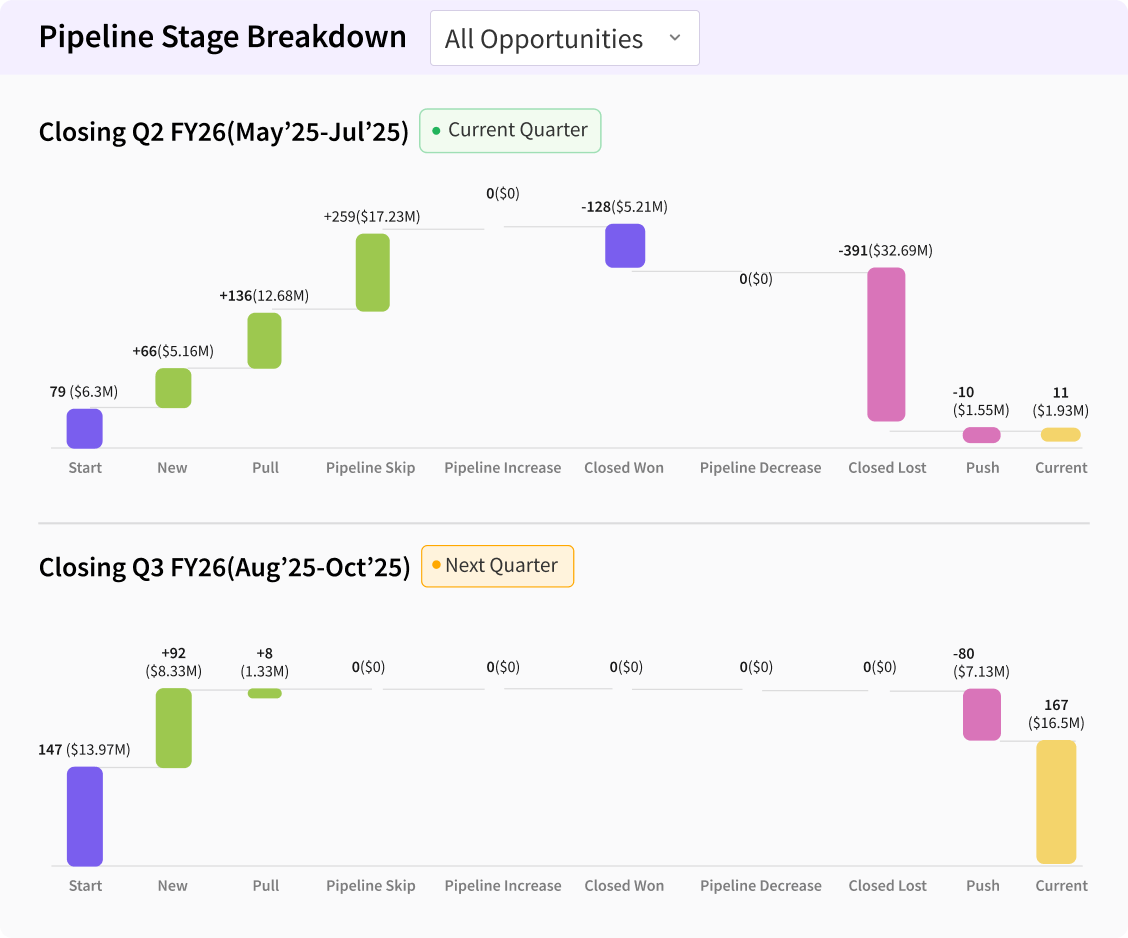
Predictive Pipeline Health

Quantify Pipeline Strength, Predict Conversion Readiness, and Pinpoint Risk in Real Time

RevSure Pipeline Health gives the GTM, MarketingOps, and RevOps teams a unified, data-driven workspace to evaluate the true health of their sales pipeline. It consolidates every signal, from opportunity-stage progression to win-rate drivers, and applies AI-based modeling to project conversion probabilities, detect risk, and surface actionable insights across current and future quarters.

A Unified Framework for Pipeline Intelligence

Pipeline Health unifies descriptive, diagnostic, and predictive analytics into a single framework, tracking real-time pipeline metrics, diagnosing win-rate drivers, and projecting closure likelihood using AI. It delivers a single source of truth that quantifies not just how much pipeline you have, but how ready it is to convert.

Pipeline Health Overview & Metrics

Track key performance indicators, pipeline value, win rate, average deal size, age, and active accounts, all in one view. Compare results week-over-week or quarter-over-quarter, toggle between Value and Volume, and filter by opportunity type (New Business, Renewal, Add-on). The Pipeline Metrics Table adds deeper quarter-level analysis with metrics like Pipeline Processed Till Date, Risk-Adjusted Value, Pulled/Pushed Pipeline, and AI-Estimated Closures.

Visualize Pipeline Vitality with Health Radar

The Health Radar gives B2B GTM leaders a visual, data-backed way to evaluate pipeline fitness. It benchmarks Value, Volume, Win Rate Till Date, Average Deal Size, Average Age, Sales Cycle Length, and Number of Accounts across quarters or years, revealing shifts in velocity, conversion efficiency, and deal quality. By comparing current and historical performance, CMOs and RevOps leaders can instantly gauge whether their pipeline is accelerating, stagnating, or signaling early conversion risk.

Predictive Win Rate to Anticipate Conversion Outcomes

Estimate the likelihood of deal closure across every stage, channel, and opportunity type. RevSure analyzes historical conversion data, deal attributes, engagement patterns, and funnel velocity to forecast win probabilities in real time. By comparing predicted win rates against actuals, GTM and RevOps teams can detect emerging risks early, validate forecast assumptions, and prioritize deals most likely to convert. Segment-level insights highlight which sources, motions, or territories show improving or declining conversion efficiency.

Win Rate Drivers to Quantify What Moves the Needle

Using likelihood analysis, the Top Factors Influencing Win Rate model measures how variables such as Lead Source, Opportunity Type, Acquisition Path, Attribution Source, Industry, and Deal Age influence overall win probability. Each factor’s effect is expressed as a relative percentage variance from historical averages, revealing which motions accelerate conversions and which require corrective action.

Mapping Revenue Efficiency with Pipeline Composition Breakdown

The Pipeline Composition Breakdown view enables GTM leaders to understand how the pipeline value and volume are distributed across sources, regions, and channels, and how each segment influences conversion efficiency. It offers table and bar chart views to compare Average Deal Size, Deal Age, Duration, Relative Win Rate, and Win Rate Influence %. Relative Win Rate quantifies the incremental lift or drag each segment contributes to total pipeline performance, helping leaders pinpoint where revenue efficiency is strongest.

Pipeline Flow & Stage Intelligence

The Pipeline Stage Breakdown and Pipeline Movements views give GTM teams an end-to-end understanding of opportunity progression and funnel efficiency. Stage Breakdown visualizes pipeline distribution across stages with comparisons by Value, Volume, Age, or Duration to benchmark performance across periods. The Movements view complements this with a dynamic waterfall visualization tracking Start (Walk-in), New, Pull, Closed Won/Lost, Push, and Current values.

Pipeline Trends & Forward Visibility

Track open pipeline, cumulative closed-won/lost, and win rate over time, allowing users to zoom into specific timeframes to monitor booking pace and decay. The Pipeline Breakdown Trend visualizes weekly or monthly stage-wise distribution, with Value or Volume modes and a Stack 100% toggle to reveal shifts in funnel balance between early and late-stage opportunities. Finally, the Open Pipeline Trends by Quarter of Close view projects open pipeline across the next eight quarters, filterable by region, channel, or motion.

See RevSure’s Features in Action

Overhaul Customer Story - Leveraging RevSure for Unified Pipeline Management and Hypergrowth
What are the best performing marketing campaigns, and how are they trending quarter? Which A/B tests are actually accelerating opportunities?
Beyond Numbers: How SnapLogic Uses RevSure to Gain Actionable Insights From Their Data
What are the best performing marketing campaigns, and how are they trending quarter? Which A/B tests are actually accelerating opportunities?
BigID Customer Story - Deciphering the Marketing Funnel
What are the best performing marketing campaigns, and how are they trending quarter? Which A/B tests are actually accelerating opportunities?
RevSure Reli Dashboard
RevSure Full Funnel Data Platform
RevSure Data Hygiene & Maintenance
Pipeline Health Module - Product Walkthrough
RevSure Customer Story Overhaul - Karin Stevens - Unified Insights and Enhanced Pipeline Management

Predictability. Precision. Performance.

With Pipeline Health, RevSure transforms pipeline visibility from a reactive inspection to a proactive, AI-driven discipline, helping every GTM team achieve confident, consistent growth.
See a DemoPricingFeatures ListIntegrationsImplementationWhy RevSureFuture of AttributionFAQsAll-in-One Answer HubSecurity Center
Read RevSure reviews on G2