Want to see RevSure in action
Schedule a 30-minute demo
Book a Demo
Back to Templates


A unified, account-centric workspace for targeting, engagement, and pipeline impact
Account-based marketing promises precision targeting and higher-value deals, but many organizations struggle to maintain a clear view of how target accounts are actually progressing toward revenue. Engagement signals often sit in marketing tools, sales activity lives in CRM systems, and campaign attribution is tracked separately. Without a unified perspective, teams find it difficult to identify which accounts are gaining momentum, which ones need attention, and which programs are truly driving pipeline.
RevSure’s ABM Performance Dashboard Template brings these signals together into a single account-centric workspace. It connects marketing engagement, intent signals, pipeline progression, and campaign attribution so GTM teams can focus their efforts on the accounts most likely to convert and grow.
This template is designed for B2B organizations running account-based strategies across enterprise and mid-market segments. Demand generation teams, sales leaders, RevOps professionals, and executive stakeholders rely on it to maintain visibility into how target accounts engage and move through the pipeline.
Marketing teams use the dashboard to evaluate campaign influence and ensure that target accounts are receiving the right level of engagement. Sales and RevOps teams rely on it to monitor coverage, identify opportunities for outreach, and track how priority accounts progress toward revenue. Leadership teams use the view to understand where ABM investments are generating meaningful pipeline and business impact.
By consolidating marketing and sales signals into one account-level view, the dashboard creates a shared understanding of account health and progression.
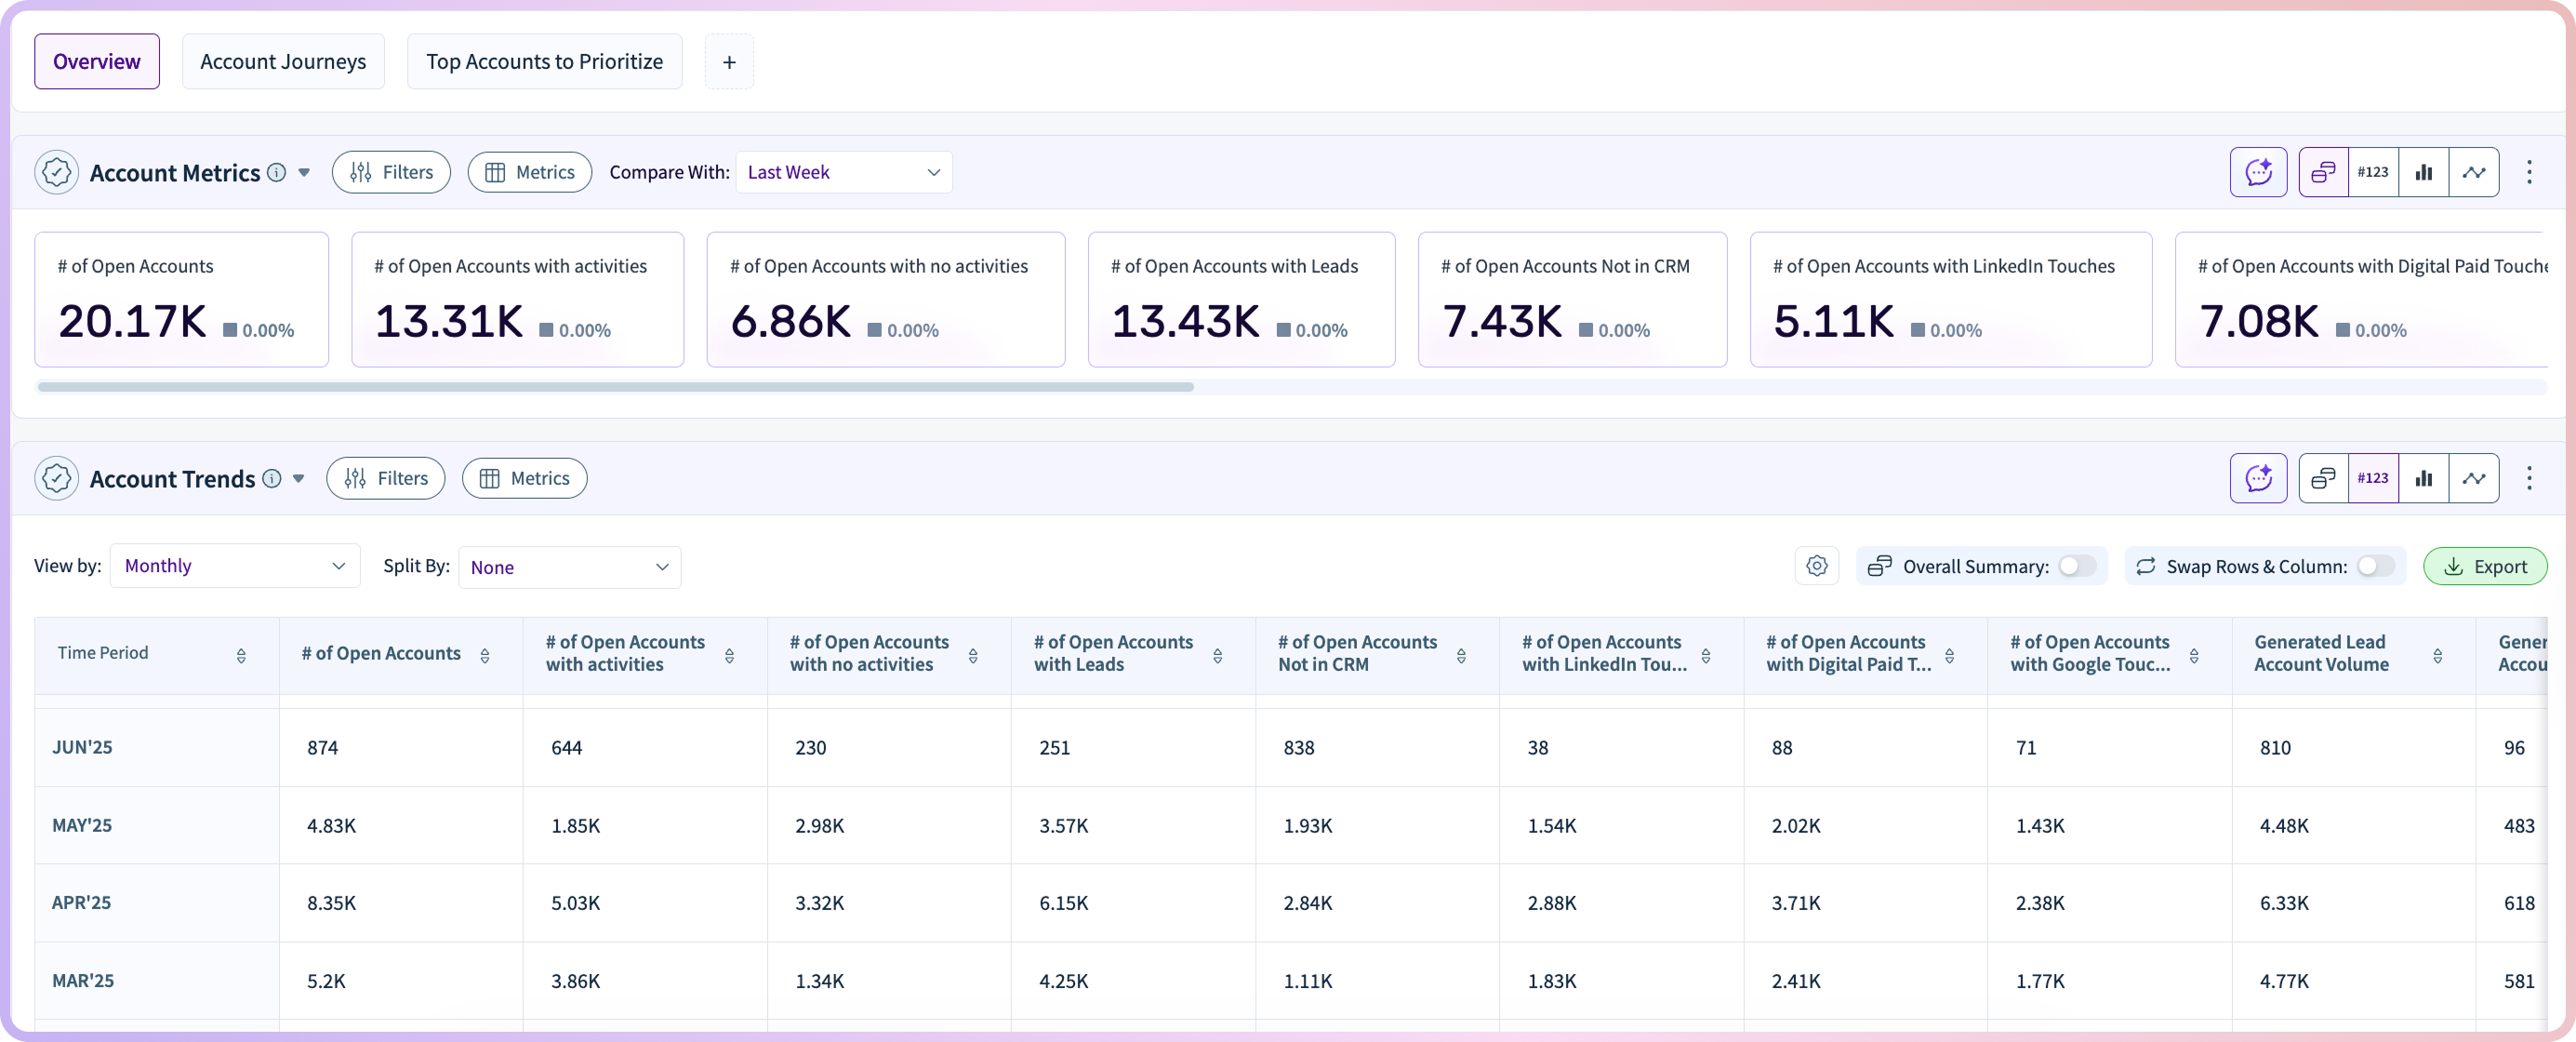
At the core of the dashboard is a detailed view of engagement across target accounts. Marketing interactions, digital behavior, and campaign touches are brought together to show how accounts are interacting with the business across multiple channels.
This visibility helps teams understand which accounts are actively engaging and which may require additional outreach or attention. Instead of treating engagement metrics as isolated signals, the dashboard links activity to account-level momentum and pipeline movement.
Teams can quickly identify patterns such as increasing engagement, new intent signals, or accounts that have gone quiet after initial interest. These insights help marketing and sales coordinate timely outreach and prioritize the accounts most likely to progress.
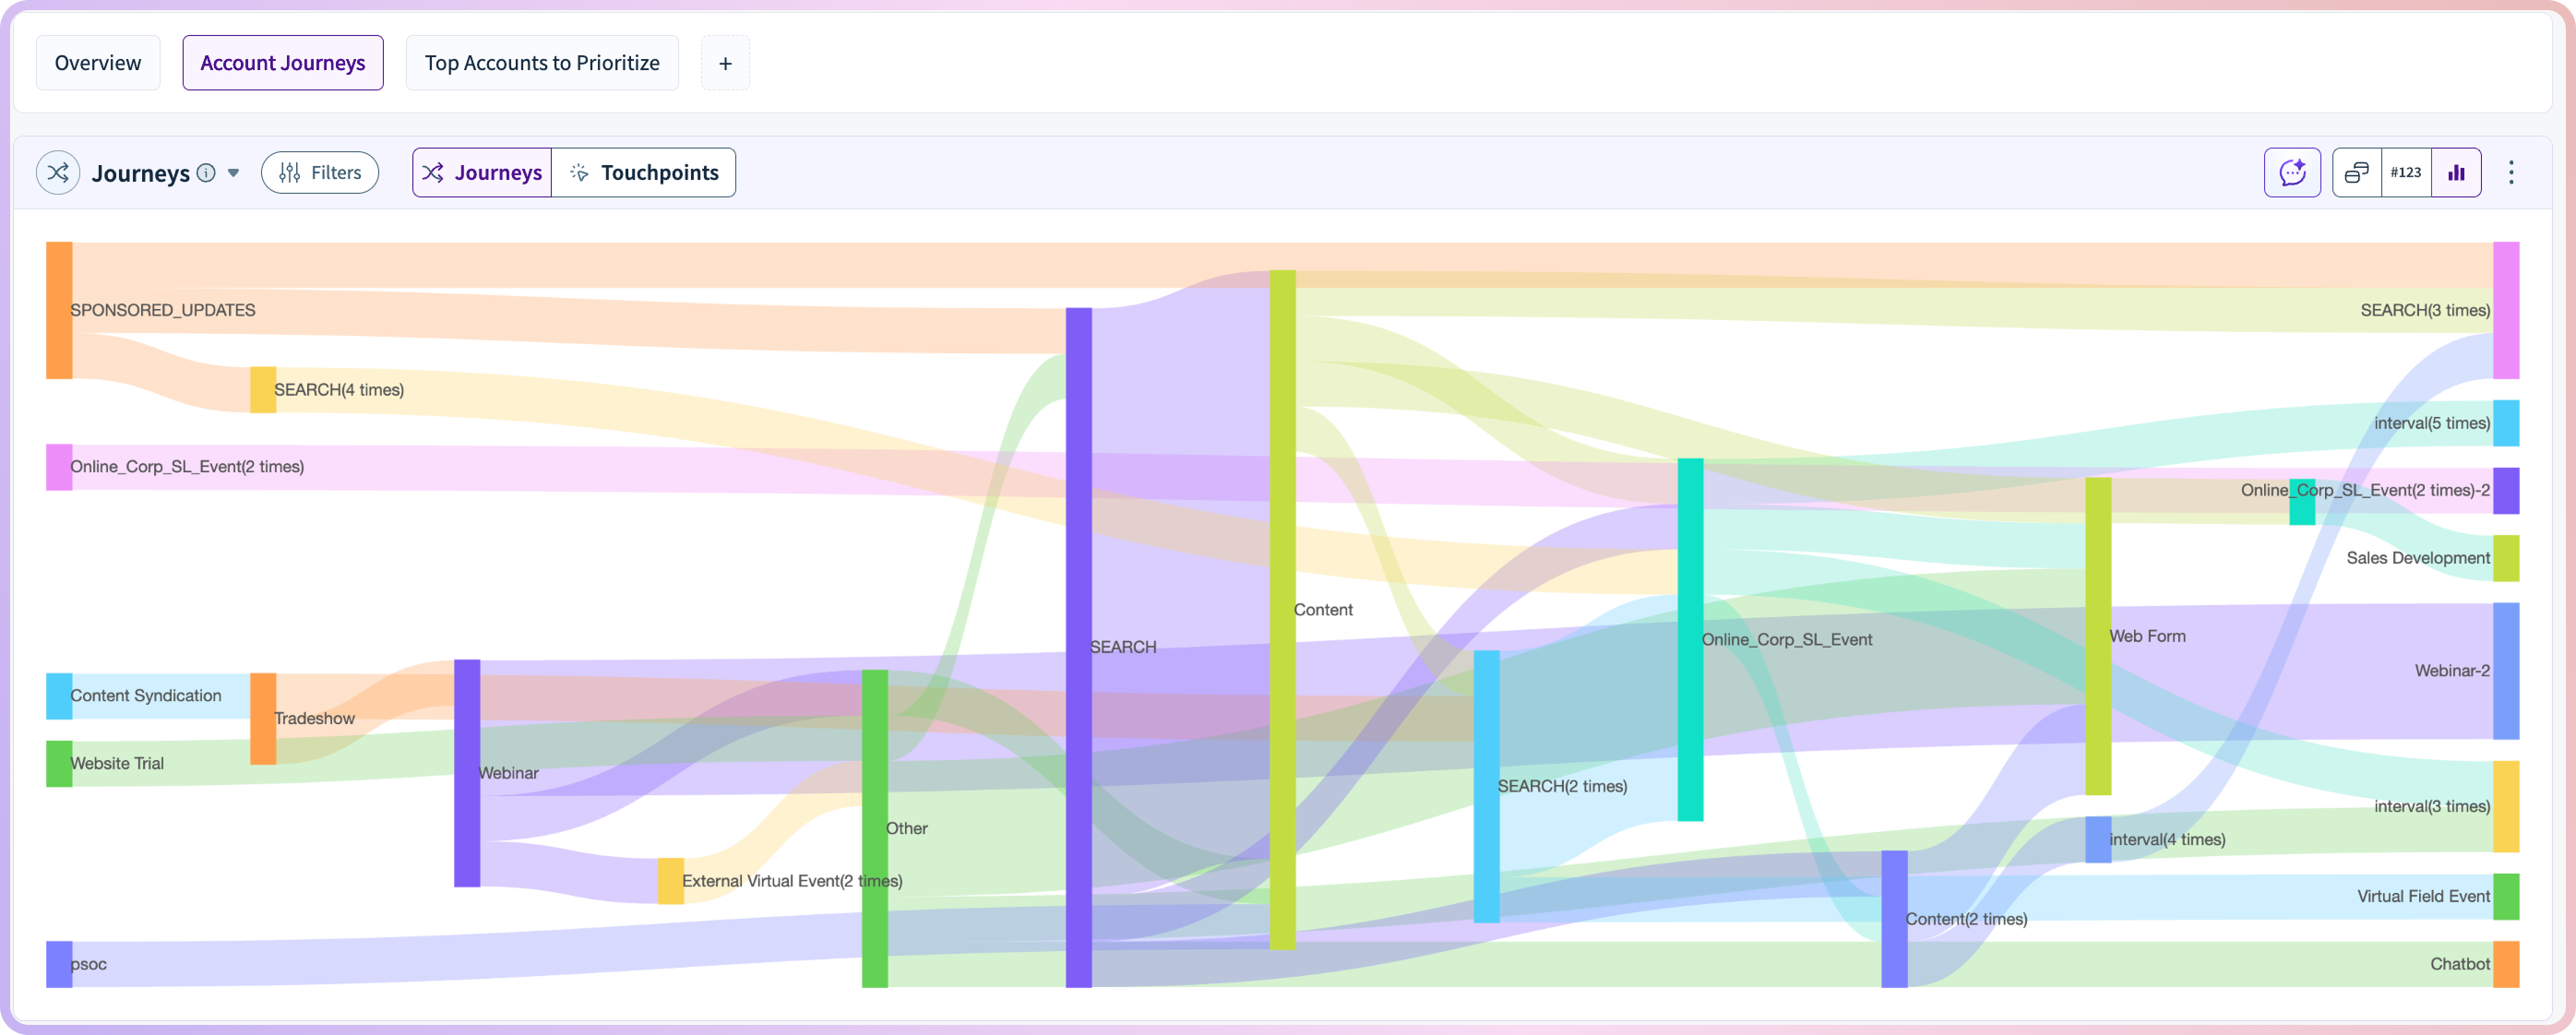
Beyond engagement, the ABM Performance Dashboard shows how accounts move through the funnel and into the pipeline. This stage-level visibility helps teams understand where accounts currently sit in their journey and where they may be slowing down.
By examining pipeline progression across target accounts, teams can identify bottlenecks, stalled deals, or stages where accounts consistently drop off. This insight allows both marketing and sales teams to adjust their approach, whether through additional engagement, tailored content, or targeted outreach.
Understanding the journey path of accounts also provides a clearer picture of how engagement signals translate into opportunity creation and pipeline growth.
One of the most valuable capabilities of the ABM Performance Dashboard is its ability to connect campaigns and channels directly to account progression. Instead of measuring campaign success purely through leads or impressions, the template shows how programs influence engagement, opportunity creation, and pipeline value within target accounts.
This account-level attribution helps teams understand:
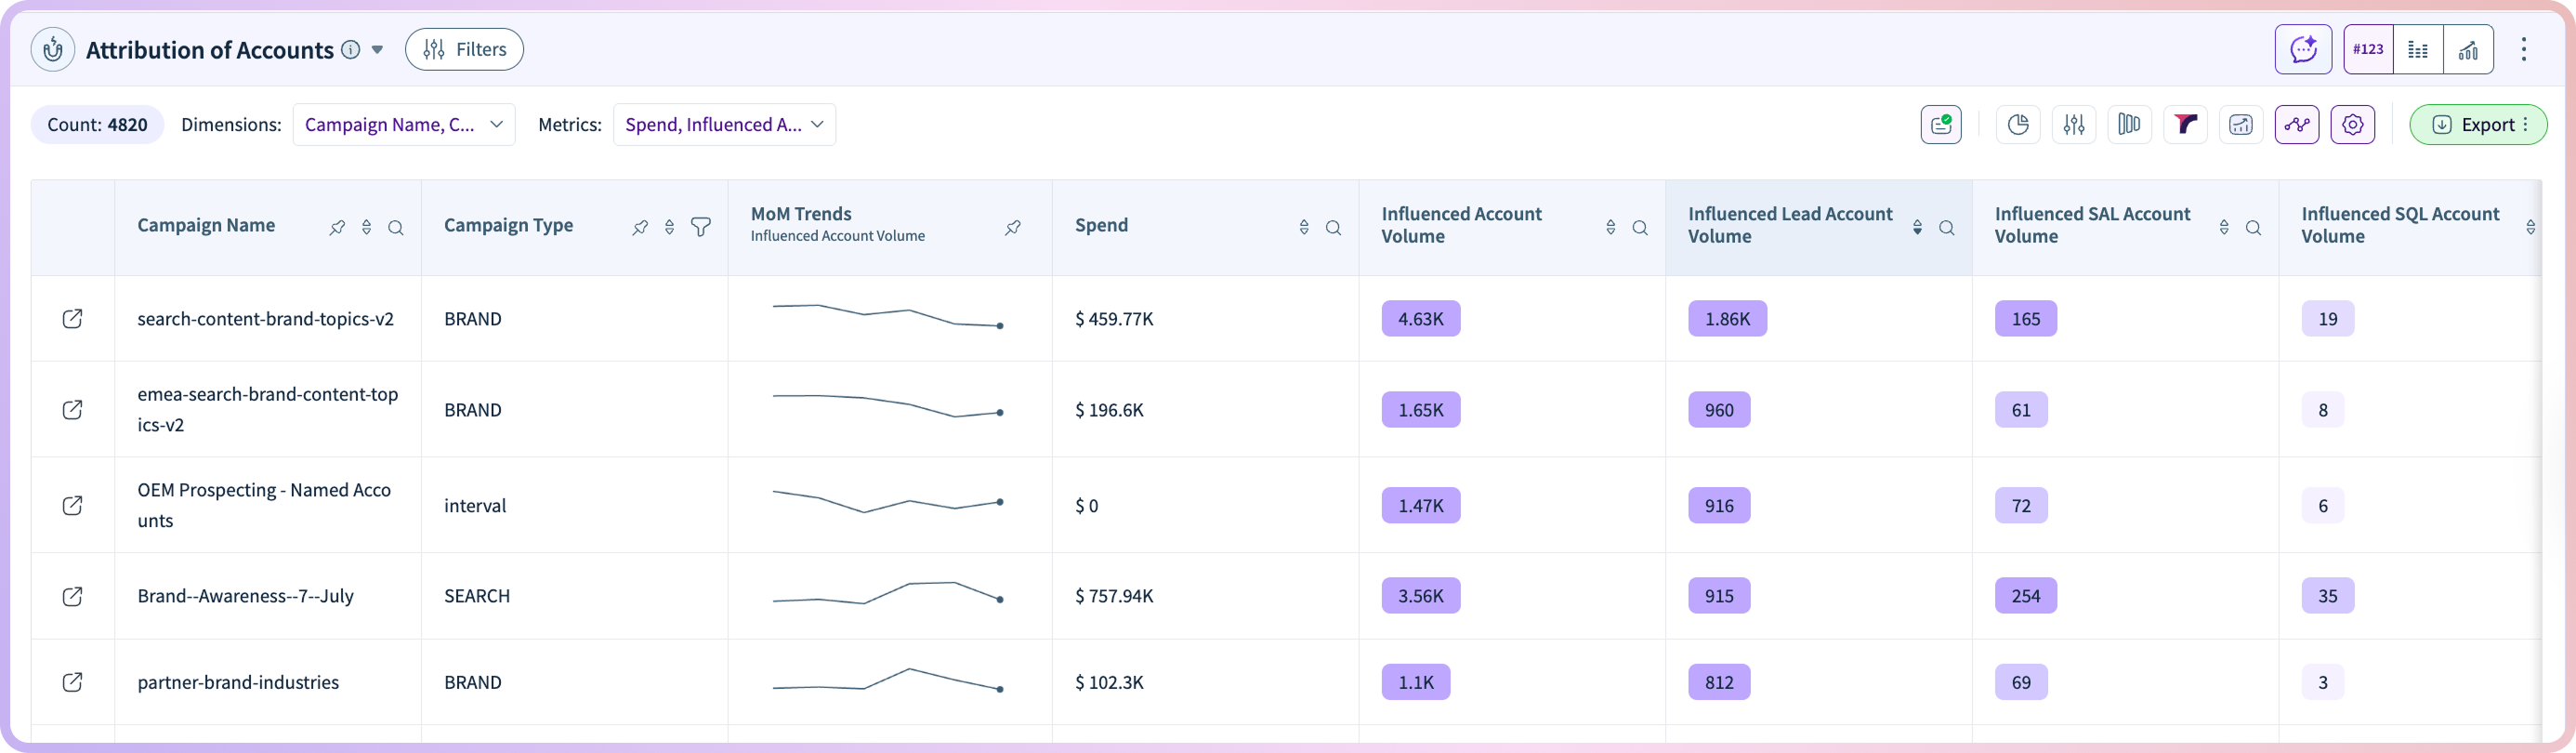
With these insights, marketing teams can refine their ABM strategy and focus resources on the programs that create meaningful momentum.
The ABM Performance Dashboard Template helps teams move beyond fragmented engagement metrics to a clearer understanding of how target accounts progress toward revenue. By combining engagement signals, journey visibility, pipeline progression, and attribution into a single view, it transforms ABM reporting into a strategic decision-making tool.
Marketing teams gain confidence in which programs drive account momentum. Sales teams know where to focus outreach for maximum impact. Revenue leaders gain a transparent view of how ABM strategies translate into pipeline and growth.
Next step: If you’re using RevSure, launch the ABM Performance Dashboard Template to identify which target accounts are building momentum and where your teams should focus next. If not, book a demo to see how RevSure helps unify engagement, pipeline, and account intelligence into a single revenue view.
What is an ABM performance dashboard?
An ABM performance dashboard is a reporting tool that tracks how target accounts engage, progress through the pipeline, and contribute to revenue by combining marketing, sales, and attribution data.
How do you measure ABM performance in B2B?
ABM performance is measured by tracking account-level engagement, pipeline progression, opportunity creation, and revenue impact across target accounts.
Why is it difficult to track account progression in ABM?
Account data is often split across marketing platforms, CRM systems, and attribution tools, making it hard to get a unified view of engagement, intent, and pipeline movement.
What insights does the ABM Performance Dashboard Template provide?
It shows how target accounts engage, where they are in the funnel, which accounts are gaining momentum, and how campaigns influence pipeline and revenue.
How does this dashboard help prioritize target accounts?
It highlights engagement trends, intent signals, and pipeline stages, helping teams focus on accounts most likely to convert and take timely action.
Who should use an ABM performance dashboard?
Demand generation teams, sales leaders, RevOps, and executive teams use it to align marketing and sales efforts around high-value target accounts.
How does it track account engagement across channels?
It combines interactions from marketing campaigns, digital behavior, and sales activities to provide a unified view of account engagement.
Can you measure campaign impact at the account level?
Yes, the dashboard connects campaigns and channels to account progression, showing how marketing efforts influence engagement, opportunities, and pipeline value.
How does this differ from traditional ABM reporting?
Traditional ABM reports focus on isolated engagement metrics, while this dashboard connects engagement, pipeline progression, and revenue outcomes at the account level.
What metrics are most important for ABM performance?
Key metrics include account engagement levels, intent signals, pipeline progression, opportunity creation, conversion rates, and revenue contribution from target accounts.