Want to see RevSure in action
Schedule a demo now
Book a Demo


Budget allocation remains one of the most debated aspects of marketing planning. Despite advances in attribution, many GTM teams still spread spend across channels based on historical averages, last year’s baselines, or internal lobbying. In a world where CFOs demand measurable ROI and boards expect accurate forecasting, this approach is increasingly inadequate.
Response Curve Analysis, embedded in RevSure’s Marketing Mix Modeling (MMX), replaces intuition with mathematically derived ROI curves. It models the functional relationship between spend and pipeline outcomes, enabling GTM and finance teams to optimize efficiency, detect saturation points, and forecast future performance with confidence.
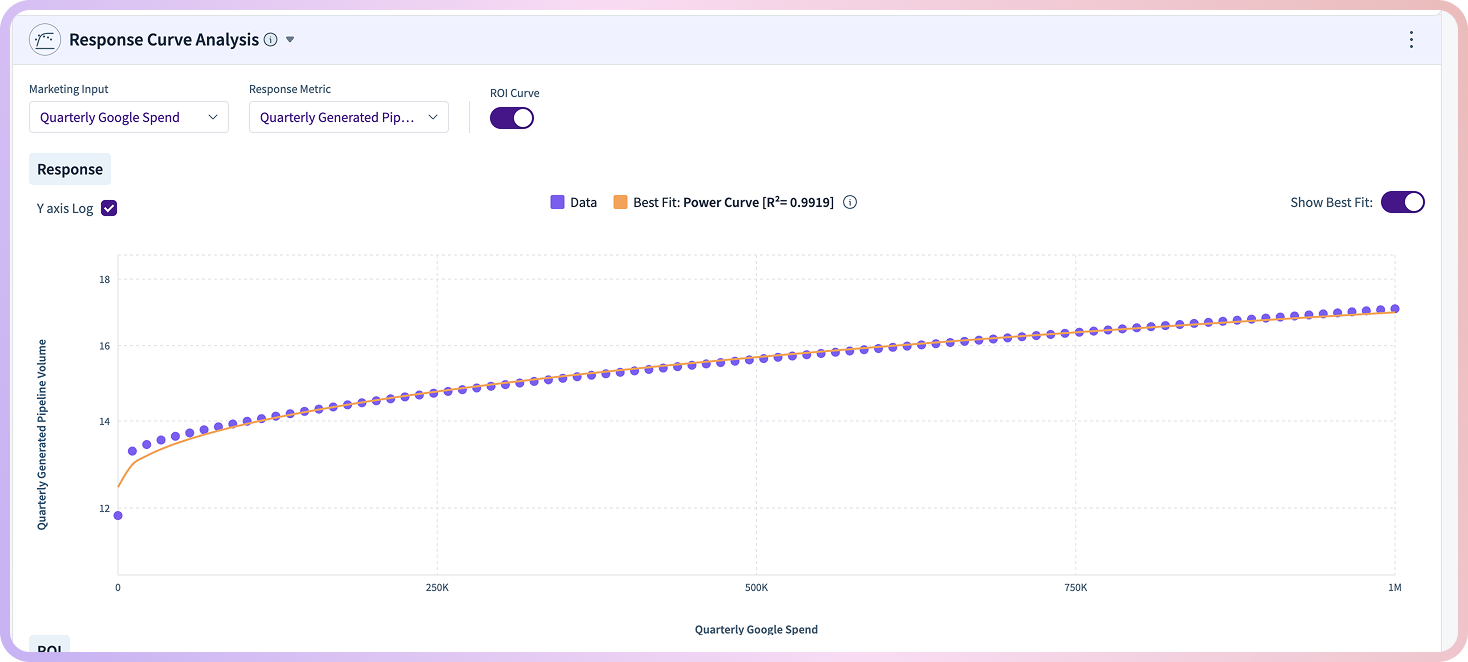
A response curve is an estimation of how incremental marketing spend impacts business outcomes, such as pipeline or bookings. By treating spend as the independent variable and pipeline as the dependent variable, curves can be derived through regression and optimization techniques.
The shapes typically observed in B2B channels fall into three categories: concave curves, where returns diminish as spend increases; S-curves, where response accelerates before plateauing; and linear approximations, where scale is steady but costly.
RevSure MMX employs modeling techniques, including log-linear regression and Bayesian adjustments, along with controls for seasonality and noise, to produce statistically valid response functions. These curves provide more than descriptive insight—they create a predictive framework for planning.
RevSure’s Marketing Mix Modeling has already established itself as a comprehensive framework for measuring spend efficiency across online and offline channels. The addition of Response Curve Analysis extends MMX with ROI curves that are embedded directly in the Marketing Performance Dashboard.
This is not a retrospective report. It is an operational tool for dynamic, evidence-based budget governance.
Response Curve Analysis provides utility at multiple layers of planning. In quarterly resets, allocations can be recalibrated based on curve-derived marginal ROI instead of static percentages. Finance and marketing leaders can run what-if simulations: how does the pipeline shift if LinkedIn spend is doubled, or if paid search investment is reduced to fund in-person events?
At the campaign level, curves identify which subsets within a channel still have headroom and which are saturated. This precision prevents over-funding underperforming initiatives while ensuring scalable opportunities are fully capitalized. For board reporting, ROI curves demonstrate not only what past spend achieved but also what incremental dollars would have achieved, strengthening financial alignment.
Historically, budget discussions often collapsed into political debates between teams advocating for their preferred channels. With ROI curves, those arguments are replaced by quantitative evaluation. Leaders no longer ask, “Which channel deserves more budget?” but rather, “Where is the marginal return highest for the next $50K?” and “Which allocations maximize total pipeline yield?”
By reframing the conversation in mathematical terms, Response Curve Analysis establishes marketing as a disciplined allocator of growth capital.
While ROI curves deliver immediate value, their role in RevSure’s platform extends further. As the agentic AI layer evolves, these curves will serve as the foundation for autonomous budget orchestration. Future capabilities include proactive alerts when a channel nears saturation, automatic rebalancing of spend week by week, and predictive modeling that anticipates saturation before it occurs.
This represents a transition from static, annual budget planning toward continuous, AI-driven optimization of marketing portfolios.
Modern GTM leaders need frameworks that withstand financial scrutiny and enable allocation at the speed of change. Response Curve Analysis in RevSure MMX provides exactly that. Mathematically modeling spend-response dynamics allows teams to identify saturation points, optimize allocations, and forecast outcomes with data-backed precision.
With ROI curves embedded in the Marketing Performance Dashboard, marketing and finance gain a shared language for decision-making. The result is not just better reporting but a new operating model for how growth capital is deployed. In an environment where efficiency is paramount, the advantage will not go to those who spend the most; it will go to those who understand the curve.