Want to see RevSure in action
Schedule a demo now
Book a Demo


Brand awareness has always mattered. But for years, it has been one of the hardest parts of marketing to quantify. Teams could track impressions, clicks, or engagement, yet the real question remained unanswered: Is our brand actually driving growth? With the launch of the Brand Metrics Dashboard, RevSure makes it easier for marketing and revenue teams to monitor brand visibility trends, benchmark against competitors, and connect awareness signals to pipeline outcomes. Instead of treating brand as a “soft” metric, teams can now evaluate it with the same rigor as performance marketing.
Buyers don’t search for brands randomly. Search behavior reflects attention, intent, and market awareness. When search interest rises, it often signals that a brand is becoming more relevant in the buyer journey. When it declines, it can indicate competitive pressure or reduced mindshare.
Search interest can reveal shifts long before pipeline numbers catch up, which is why it’s one of the strongest early indicators of brand momentum.
It helps teams understand:
Yet historically, this kind of insight required jumping between external tools, exporting trend reports, and manually connecting it back to business outcomes. RevSure brings this data directly into the revenue platform.
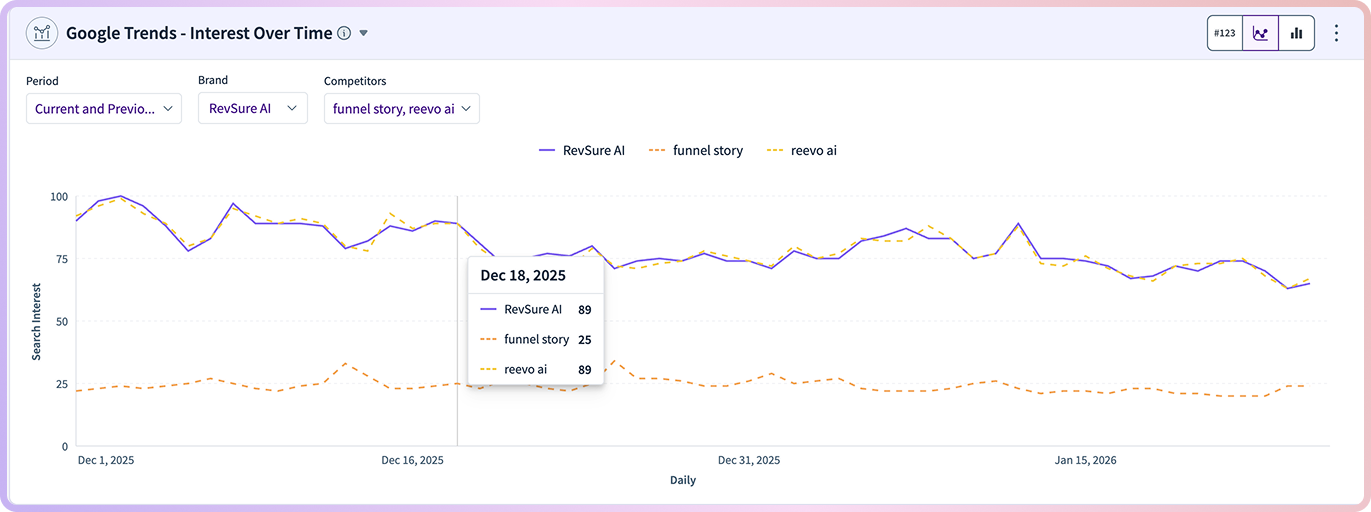
The Brand Metrics Dashboard enables teams to monitor search interest for their brand and selected competitors directly inside RevSure. Powered by Google Trends, it provides a clear view of how brand visibility changes over time. At the center of the dashboard is the Interest Over Time Index, a standardized score from 0 to 100 that represents relative search demand within a chosen timeframe.
This makes it easier to answer questions like: Are we gaining awareness? Is competitor interest rising faster? Did our campaign actually move the market?
The Interest Over Time index normalizes search interest so teams can interpret brand momentum without needing raw search volume. A score of 100 represents the peak interest during the selected period, while lower scores represent relative drops in interest. This creates a consistent way to track brand visibility trends across time and competitors.
Instead of relying on fragmented brand metrics, RevSure gives teams a single standardized signal of market attention.
Monitoring search interest is powerful, but visibility alone isn’t enough. Modern marketing leaders are expected to prove how brand investments contribute to revenue. RevSure helps teams go beyond awareness metrics by connecting brand touches directly to pipeline outcomes. This allows organizations to measure whether brand campaigns are influencing buyer behavior deeper in the funnel.
With RevSure, teams can evaluate:
This is how brand becomes measurable, not through impressions, but through its downstream effect on pipeline performance.
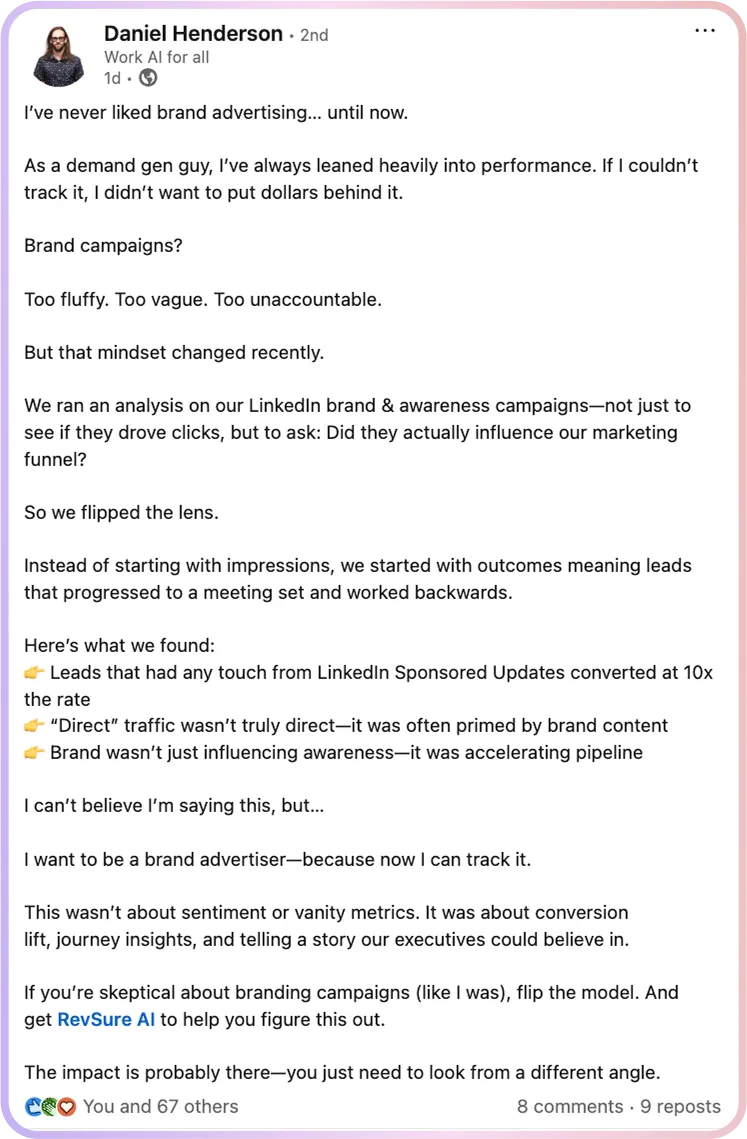
Daniel Henderson, Head of Digital Marketing at Glean, an AI-powered workplace search platform, has long taken a performance-first approach to marketing. Like many revenue-focused leaders, Daniel was initially skeptical of brand campaigns because they often appeared disconnected from measurable ROI.
Brand investments can sometimes feel difficult to defend in executive conversations when the only metrics available are reach, engagement, or clicks. RevSure helped Daniel and his team reframe the conversation entirely. Instead of evaluating LinkedIn awareness campaigns through surface-level engagement, they analyzed them through the lens of pipeline outcomes.
What they uncovered was significant: brand touches weren’t just “nice to have.” They materially improved conversion rates and accelerated funnel progression. Accounts exposed to awareness efforts moved through the buyer journey faster and converted more efficiently.
With RevSure, Daniel’s team was able to validate brand initiatives using executive-ready revenue data, transforming what was once seen as a “fluffy” strategy into a proven growth driver.
Daniel recently shared more about this shift in perspective in a LinkedIn post, highlighting how brand measurement becomes far more powerful when tied directly to pipeline impact.
The Brand Metrics Dashboard is available directly within RevSure: Marketing Performance → Google Trends – Interest Over Time From there, teams can track brand and competitor search interest trends instantly, without leaving the platform.
Brand is often the earliest signal of future pipeline. Before opportunities appear in CRM, buyers are searching, comparing, and building awareness. Capturing those shifts early helps teams stay ahead of the market.
With the Brand Metrics Dashboard, RevSure enables organizations to:
Brand no longer has to live in the world of vanity metrics. With RevSure, it becomes a measurable, revenue-connected growth lever.